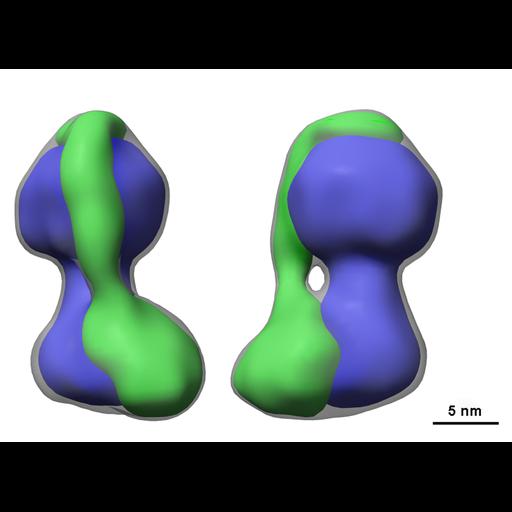
A model of the bovine mitochondrial ATP synthase at 32 Angstrom resolution as determined by electron cryomicroscopy of detergent solubilized single particles obtained from heart mitochondria. A rendered view of the experimental EM map is shown as a semi-transparent grey surface. The blue region corresponds with the F1-c10 subcomplex and the green region represents the peripheral stalk subcomplex including the peripheral domain of Fo. The scale bar represents 50 Angstroms (5 nm). From: Rubinstein JL, Walker JE, Henderson R. Structure of the mitochondrial ATP synthase by electron cryomicroscopy. EMBO J. 2003;22:6182-92. merged from Fig. 4C and 5A. Available at: http://www.nature.com/emboj/journal/v22/n23/pdf/7595518a.pdf
| Spatial Axis | Image Size | Pixel Size |
|---|---|---|
| X | 4800px | —— |
| Y | 3503px | —— |