Using a variant of miniSOG, a genetic probe for correlated light and electron microscopy (CLEM), we determined the form, fine structure and quantified the distribution of melanopsin-expressing retinal ganglion cell (ipRGC) projections within multiple brain regions. The method developed labels the entire neuron, including its axonal arbors in retinorecipient brain regions. Here the ‘synapto-projectome’ of these cells was charted in the suprachiasmatic nucleus (SCN), olivary pretectal nucleus (OPN), and subregions of the lateral geniculate. Each ipRGC axonal arbor synapsed on multiple target neurons in the SCN and OPN. Although the only direct retinal input to the OPN and SCN is from ipRGCs, the terminal arbors and boutons were different in each brain region. Also, a network of dendro-dendritic chemical synapses (DDCS) was discovered in the SCN; with ipRGC axons preferentially targeting the DDCS-linked cells. Methods used for this analysis should facilitate other CLEM studies of brain circuits at high resolution.
In this study, we exclusively expressed a membrane tethered miniSOG in all ipRGCs in mouse. After photooxidation, we collected SBEM volumes from 7 distinct tissues or brain regions that contained ipRGC features: retina, optic nerve (ON), SCN, ventral aspect of lateral geniculate nucleus (vLGN), intergeniculate leaflet (IGL), dorsal aspect of lateral geniculate nucleus (dLGN), and OPN.
Tissue Preparation, Fluorescence Imaging, and Photooxidation of Mouse Retina and Brain
At least three weeks after intravitreal injection of AAV2-EF1α-DIO-miniSOG-f and AAV2-EF1α-DIO-tdTomato into Opn4Cremice, the mice were anesthetized with ketamine/xylazine and transcardially perfused with Tyrode’s solution followed by 4% formaldehyde/ 0.1% glutaraldehydein 0.1M phosphate buffered saline (PBS). The retina and brain were dissected and post-fixed with 4% formaldehyde in 0.1 M PBS on ice for 2h and then brain was cut into 100-μm-thick slices. For miniSOG photooxidation, tdTomato expressed ipRGCs and ipRGC neurites were identified using a Leica SPE II inverted confocal microscope and the retina and brain tissue were fixed with 2.5% glutaraldehyde, 2.5 mM CaCl2 in 0.15 M Sodium Cacodylate buffer (CB) pH 7.4, and the tissue was rinsed with ice cold CB, and blocked for 30 min with 50 mM glycine, 10 mM Potassium cyanide and 5 mMaminotriazole in CB. Freshly prepared diaminobenzidine (DAB free base, Sigma) in CB was added to the tissue, and ipRGCs and axons were illuminated with 450–490 nm light from a Xenon lamp for 20–25 min until a light brown reaction product was observed in place of the green fluorescence of MiniSOG. The tissue was then processed for SBEM.
SBEM Staining and Imaging
SBEM Staining and Imaging
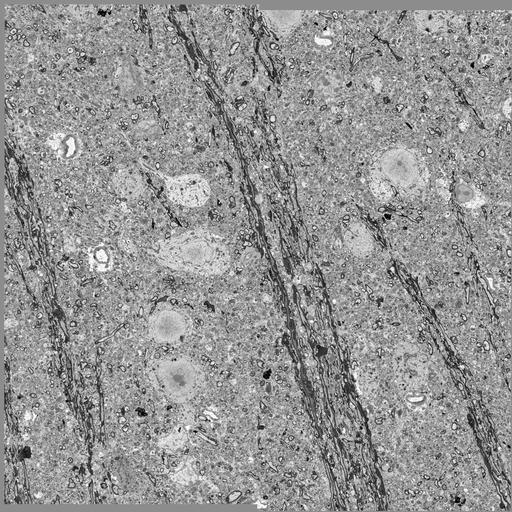
Tissue was prepared for SBEM as previously described (Deerinck et al., 2010). Briefly, tissue was washed with 0.15 M CB and then placed into 2% OsO4/1.5% potassium ferrocyanide in 0.15 M CB containing 2 mM CaCl2. The slices were left for 30 min on ice and then 30 min at room temperature (RT). After thorough washing in double distilled water, the slices were placed into 0.05% thiocarbohydrazide for 30 min. The slices were again washed and then stained with 2% aqueous OsO4 for 30 min. The slices were washed and then placed into 2% aqueous uranyl acetate overnight at 4°C. The slices were washed with water at RT and then stained with 0.05% en bloc lead aspartate for 30 min at 60°C. The slices were washed with water and then dehydrated on ice in 50%, 70%, 90%, 100%, 100% ethanol solutions for 10 min at each step. The slices were then washed twice with dry acetone and then placed into 50:50 DurcupanACM:acetone overnight. The slices were transferred to 100% Durcupan resin overnight. The slices were then flat embedded between glass slides coated with mould-release compound and left in an oven at 60°C for 72 h. SBEM data was collected with a 3View unit (Gatan Inc., Pleasanton, CA, USA) installed on a Merlin field emission SEM (Carl Zeiss Microscopy, Jena, Germany). The retina and brain volumes were collected in 2.0 to 2.4 kV accelerating voltages, with a raster size of 20,000×20,000 or 24,000 x 24,000 and pixel dwell time of 0.5 -1.5 μs. The pixel sizes were 4.0-7.3 nm, depending on the raster size and section thickness was 40-60 nm. Before each volume was collected, a low magnification (∼500X) image was collected of the block face to confirm the anatomical location of the volume based on tissue landmarks, such as the SCN, IGL, dLGN, vLGN and OPN. Once a volume was collected, the histograms for the slices throughout the volume stack were normalized to correct for drift in image intensity during acquisition. Digital micrograph files (.dm4) were normalized using Digital Micrograph and then converted to MRC format. The stacks were converted to eight bit, mosaics were stitched, and volumes were manually or semi automatedly traced for reconstruction and analysis. Stereology was performed using a custom plug-in for IMOD.