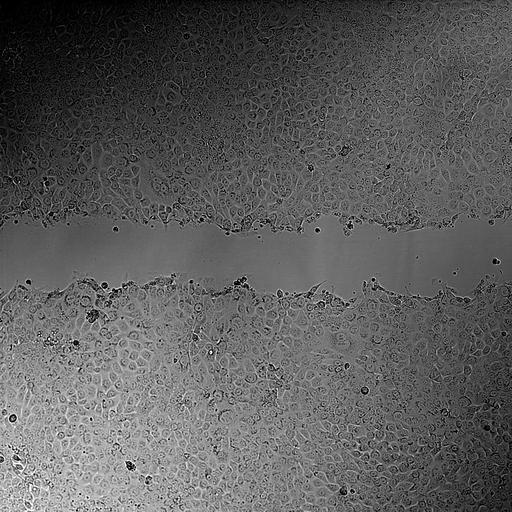
Wound Healing Assay Time series DIC images of mouse DA3 cells, derived from the mouse mammary adenocarcinoma cell line D1-DMBA-3, induced in BALB/C mice by dimethylbenzanthracene were grown to 90% confluence. A scratch approximately 300um wide was made in the cell monolayer, and images were recorded every 14.5 min for 26 hr. This time series image, obtained with PHA (c-Met inhibitor) treatment, is part of a group of 4 time series images (CIL:45451 to CIL:45454).
DA3 cells expressing the fluorescent protein mCherry were grown to 90% confluence in wells of 2 cm diameter in DMEM supplemented with 10% heat-inactivated FCS (Gibco-BRL) and treated with the Met inhibitor PHA665752 (2.5 µM) for 2 hrs. A scratch was generated using a 200 µl tip, and the cells were incubated and subjected to time lapse confocal laser scanning microscopy (CLSM-510, Zeiss, Germany) for approximately 26 hrs, with images taken at 14.5 min intervals. The position of each scratch was predefined, and a macro that repetitively positions the microscope on each point was executed. The acquired differential interference contrast (DIC) channel of the time-lapse sequence (shown here) was used for the multi-cellular analysis.
| Spatial Axis | Image Size | Pixel Size |
|---|---|---|
| X | 1024px | 1.24µm |
| Y | 1024px | 1.24µm |