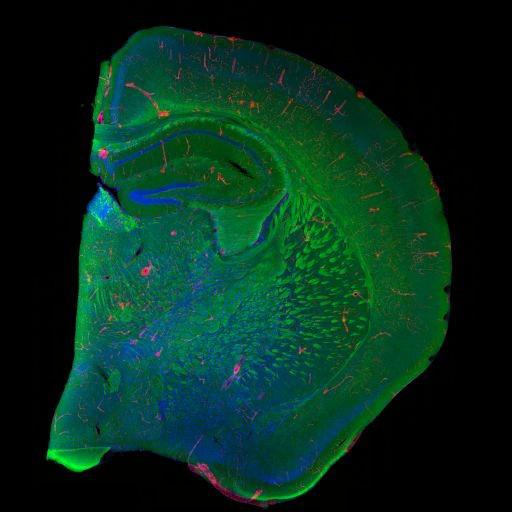
Coronal section of rat brain triple-labeled with fluoromyelin (green), DiI (red), and TO-PRO3 (blue) which stain for myelin, blood vessels, and cell bodies, respectively. A maximum projection image was compiled by acquiring images across the entire rat brain section, and through 16 optical sections spanning the thickness of the section. This image has been downsampled from the raw data image which can be accessed using the link provided to the Cell Centered Database. It is also available through the Whole Brain Catalog (http://wholebraincatalog.org).
The animal was perfused with Ringer's solution for 2 minutes followed by DiI for 10 minutes, and then 2% paraformaldehyde for 10 minutes. The brain was post-fixed overnight, and the tissue subsequently sectioned. After buffer washes, sections were stained with Fluoromyelin (1:100 overnight in cold room), rinsed with buffer washes, and subsequently stained TO-PRO3 (1:3000) for 45 minutes at room temp, rinsed and mounted using Gelvatol. 16 z-planes at 5 µm intervals across the entire section used to generate the tiled 3-D mosaic, acquired with an Olympus Fluoview 1000.
| Spatial Axis | Image Size | Pixel Size |
|---|---|---|
| X | 389px | —— |
| Y | 512px | —— |