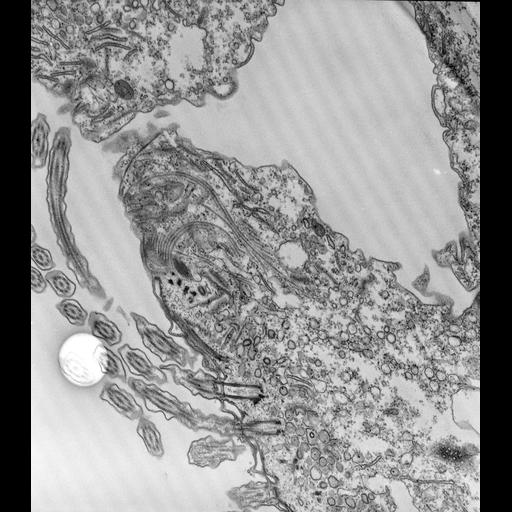
Sections show the origin of one cytopharyngeal ribbon of 12 microtubules from the nodes and show the tight curve the ribbon follows over the cytostomal cord. These ribbons move discoidal vesicles, acidosomes and carrier vesicles along one of their surfaces. Carrier vesicles are most abundant under the quadrulus where they arise from early endosomes and where the highest concentration of parasomal sacs and early endosomes occurs within the cell. These vesicles rapidly fuse with acidosomes. The acidosomes then dock at the membrane of the nascent phagosome. TEM taken on 4/10/74 by R. Allen with Hitachi HU11A operating at 75kV. Neg. 12,750X. Published in Poste and Nicolson (eds.) Membrane Fusion, Elsevier/North Holland Biomed. Press, p.735, 1978 and in J. Cell Biol. 1974. 63:904-22. Adapted with permission.
Standard glutaraldehyde fixation followed by osmium tetroxide, dehydrated in alcohol and embedded in an epoxy resin. Microtome sections prepared at approximately 75nm thickness. The raw negative was scanned with an Epson Perfection V750 Pro and this high resolution image is best used for quantitative analysis. Additional information available at (http://www5.pbrc.hawaii.edu/allen/).
| Spatial Axis | Image Size | Pixel Size |
|---|---|---|
| X | 4641px | 1.2nm |
| Y | 5287px | 1.2nm |