Licensing

Attribution_nc_sa
Attribution Non-Commercial Share Alike:This image is licensed under a Creative Commons Attribution, Non-Commercial Share Alike License. View License Deed | View Legal Code
Comments: Powered by Pnyxe

Description

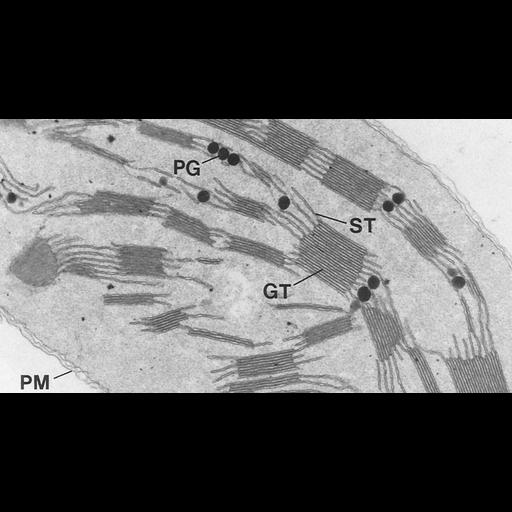
Wheat seeds were germinated and grown for 6 days in the dark, greened at high light intensity for 4 days, then prepared for thin section electron microscopy. This chloroplast from a wild-type plant shows the characteristic grana stacks of thylakoids (GT) and unstacked stromal regions (ST). Also seen are osmiophilic globules (PG). This set of grouped images, which also shows freeze-fracture views, includes the chlorophyll b-deficient CD3 mutant.

Technical Details

Leaf segments 1 cm from the tip were fixed with 2% glutaraldehyde, postfixed with 1% osmium tetroxide, dehydrated, and embedded in Spurrs resin. Thin sections were stained with uranly acetate and lead citrate and examined in a JEOL 100C transmission EM at 60 KV, and images recorded on film. See Fig 5 in K D Allen et al. 1988 Biogenesis of thylakoid membranes is controlled by light intensity in the conditional chlorophyll b-deficient CD3 mutant of wheat. J Cell Biol 107:907-919

Biological Sources

NCBI Organism Classification
Triticum sp.
Cell Type
leaf
Cellular Component
chloroplast
plastid thylakoid membrane
granum

Biological Context

Biological Process
photosynthesis
organelle organization

Attribution

Names
K D Allen
M E Duysen
L A Staehelin
Published
K D Allen, ME Duysen, and LA Stahelin 1988 Biogenesis of thylakoid membranes is controlled by light intensity in the conditional chlorophyll b-deficient CD3 mutant of wheat. J Cell Biol 107:907-919
Link
Journal of Cell Biology
Pubmed
3047153

Grouping

This image is representative of a group of similar images.

Imaging

Image Type
film
Imaging Mode
transmission electron microscopy (TEM)
Parameters Imaged
electron density
Source of Contrast
differences in adsorption or binding of stain
Visualization Methods
uranyl salt
lead salt
osmium tetroxide
Data Qualifiers
processed data

Sample Preparation

Methods
glutaraldehyde fixed tissue
tissue in plastic embedment
Relation To Intact Cell
microtome-sectioned tissue

Dimensions

Spatial Axis Image Size Pixel Size
X 1812px ——
Y 972px ——
*CIL – Cell Image Library accession number. Please use this to reference an image.