Alternate header for print version


Licensing
Attribution Non-Commercial Share Alike:This image is licensed under a Creative Commons Attribution, Non-Commercial Share Alike License. View License Deed | View Legal Code
tweet  
*CIL – Cell Image Library accession number. Please use this to reference an image.

CIL:38680*  Cite 
Description

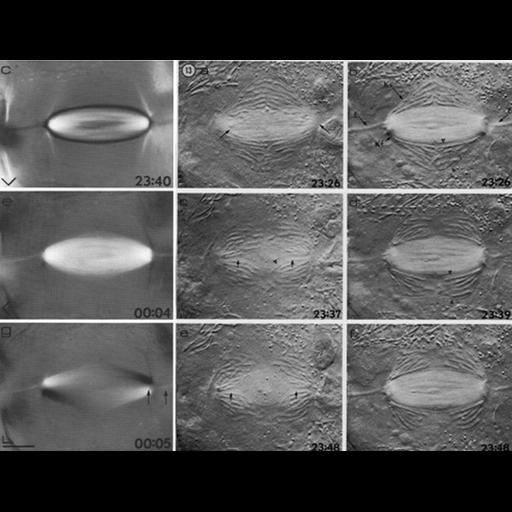
The series of three vertical columns shows various aspects of mitotic anaphase in a live Barbulanympha (protist). The left column shows the birefringent spindle imaged by polarization microscopy; the center column contains a merge of the polarizing image with differential interference (DIC) microscopy and reveals the chromosomes in a plane near the upper surface of the spindle, and the right hand column, also using merged polarization and DIC, shows the relationship between the spindle and chromosomes in a median optical section of the spindle.

Technical Details

Inoue and Ritter used high-quality sequential coronal polarization (left) and differential interfrence contrast (DIC) microscopy. In the middle column, the focus on the upper surface shows the parting seam in the nuclear envelope (between arrow pairs). The right column shows the median optical section. See: Inoué S, Ritter H Jr. (1978). Mitosis in Barbulanympha. II. Dynamics of a two-stage anaphase, nuclear morphogenesis, and cytokinesis. J Cell Biol. 77:655-84.

Biological Sources
NCBI Organism Classification
Barbulanympha
Cellular Component
spindle
Biological Context
Biological Process
mitosis
Attribution
Names
Shinya Inoue
H. Ritter Jr.
Published
Inoué S, Ritter H Jr. (1978). Mitosis in Barbulanympha. II. Dynamics of a two-stage anaphase, nuclear morphogenesis, and cytokinesis. J Cell Biol. 77:655-84
Link
Inoue mitosis Barbulanympha
Citation
Digital Object Identifier (DOI)
doi:10.7295/W9CIL38680
Archival Resource Key (ARK)
ark:/b7295/w9cil38680
Imaging
Image Type
recorded image
Image Mode
polarization microscopy
differential interference contrast microscopy
Parameters Imaged
retardance
boundaries between regions with different refractive index
Source of Contrast
form birefringence
Visualization Methods
visualization of contiguous regions
Processing History
montage
Data Qualifiers
processed data
Sample Preparation
Methods
living tissue
Relation To Intact Cell
whole mounted tissue
Dimensions
Spatial Axis Image Size Pixel Size
X 3270px ——
Y 2502px ——