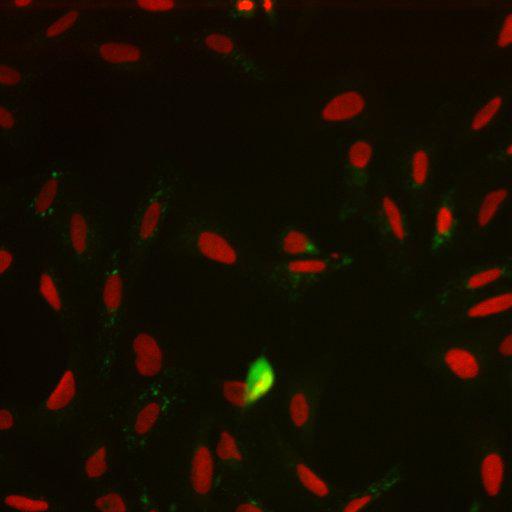
This image set is of Transfluor assay where an orphan GPCR (G-protein coupled receptor) is stably integrated into a beta-arrestin GFP (green) expressing U2OS cell line also showing nucleus (red). After one hour incubation with a compound, the cells were quenched with fixative (formaldehyde) and the plate was read on Cellomics ArrayScan HCS Reader using the GPCR Bioapplication. Negative results are a more uniform distribution of GFP throughout the cytoplasm and positive results are a peri-nuclear localization. Recommended attribution: "We used the SBS Roche Transfluor image set provided by Ilya Ravkin and available from the Broad Bioimage Benchmark Collection (www.broad.mit.edu/bbbc)." Analysis of the data set can be downloaded from http://www.broadinstitute.org/bbbc/sbs_roche_transfluor.html
The images constitute one row of a 348 well plate. The dose curve consists of 11 dose points and one control. Each concentration is duplicated in adjacent wells. Each well has three fields.
| Spatial Axis | Image Size | Pixel Size |
|---|---|---|
| X | 512px | —— |
| Y | 512px | —— |