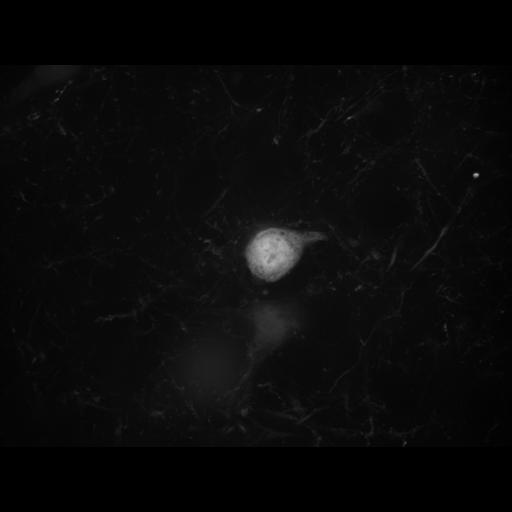
Z-stack from rat brain cortex showing a subset of fluorescent-protein expressing neurons and microglia. Most prominent in this image are the cell bodies and proximal dendrites (including the stalk of the apical dendrite, oriented toward the lower left corner) of two pyramidal neurons, and fine axons and dendrites from many other neurons coursing through the tissue. This stack is accompanied by a colorized maximum projection in the image group. Neurons are expressing soluble YFP using the neuron-specific TH1 promoter. Microglia are expressing soluble GFP (transgene inserted in the Cx3cr1 locus). The z-stack source image (provided in this image group) was acquired with an iMIC Andromeda laser spinning disc confocal microscope (http://www.till-photonics.com/Products/andromeda.php), using an Olympus UPlanSApo 60X/NA1.35 objective, and: Andor Clara (Andor) CCD Camera. Both fluorophores were excited with a 488nm laser, and so are not distinguished from each other, with these filters: Laser CleanUp, FF01-446/523/600/677 (Semrock); Dichroic, zt405/490/561/640rpc (Chroma); Emission, FF01-390/482/563/640 (Semrock). .
| Spatial Axis | Image Size | Pixel Size |
|---|---|---|
| X | 1392px | 0.107µm |
| Y | 1040px | 0.107µm |
| Z | 70px | 0.1µm |