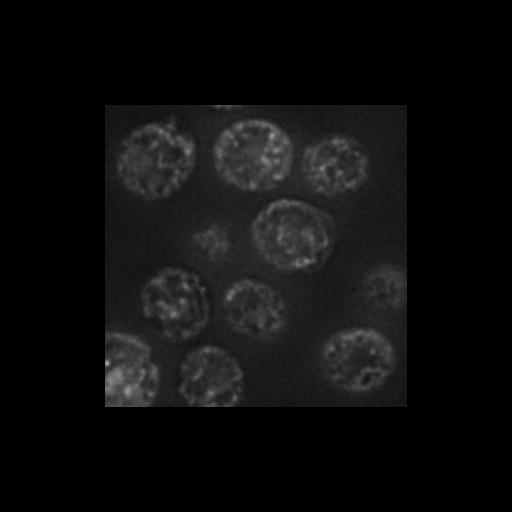
Sec63-mCherry in BY4742 sac1∆ vps74∆ highlights nuclear ER and cortical ER and/or PM. This image is the control image labeling ER for overlay with GFP-Vps74 (CIL# 24812) demonstrating that in the sac1∆ vps74∆ mutant, GFP-Vps74 localizes, in addition to the Golgi apparatus, to nuclear ER and cortical ER and/or PM. SAC1 encodes an integral membrane phosphoinositide phosphatase that is localized to the ER and Golgi. Cells grown in liquid medium were mounted in growth medium and 3D image stacks were collected at 0.4-µm z increments on a DeltaVision workstation (Applied Precision) based on an inverted microscope (IX-70; Olympus) using a 100× NA 1.4 oil immersion lens. Images were captured at 23C with a 12-bit CCD camera (CoolSnap HQ; Photometrics) and deconvolved using the iterative-constrained algorithm (Agard, 1984) and the measured point spread function. One image from the approximate center of z stack is shown in Fig1B Sec63 (ER)/sac1∆ panel (overlay CIL#24812/24813 in merge panel) in J Cell Biol. 187: 967-975. 2009. Images in Fig 1B include CIL#s 24815, 24812, 24813.
| Spatial Axis | Image Size | Pixel Size |
|---|---|---|
| X | 302px | 0.0663µm |
| Y | 302px | 0.0663µm |
| Z | 11px | 0.4µm |