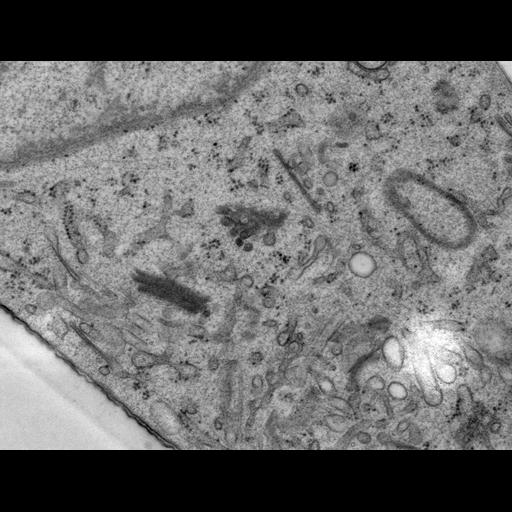
This image is one from a set of 40nm thick serial sections through part of a Golgi ribbon from a normal rat kidney cell, generated using transmission electron microscopy following incubation at 15°C to block transport out of the Golgi complex. Following temperature block, large bulging domains appear on the three trans-most cisternae. The images in this set were used in 3-dimensional reconstructions of the Golgi apparatus. For more information see: Ladinsky et al. (2002) Structure of the Golgi and distribution of reporter molecules at 20°C reveals the complexity of the exit compartments, Mol Biol Cell 13:2810-2825. The other images from this serial set are included in this image group.
Cells were grown on 100-mesh gold EM grids, and maintained at 15°C for 4 hours before plunge freezing in liquid nitrogen (BalTec HPM-010), followed by freeze-substitution (1% glutaraldehyde, 0.1% tannic acid in acetone, replaced with 4% osmium tetroxide and 0.01% uranyl acetate), then embedded in Epon-Araldite and sectioned at 40nm (UltraCut-UCT, Leica). Sections were transferred to formvar-coated copper-rhodium slot grids (EMS) and stained with 2% aqueous uranyl acetate and Reynold's lead citrate. Digital images were acquired at a magnification of 15,500X with an FEI Tecnai TF20 transmission EM. For additional details refer to: Mol Biol Cell 13:2810-2825.
| Spatial Axis | Image Size | Pixel Size |
|---|---|---|
| X | 1406px | 0.0118µm |
| Y | 1069px | 0.0118µm |