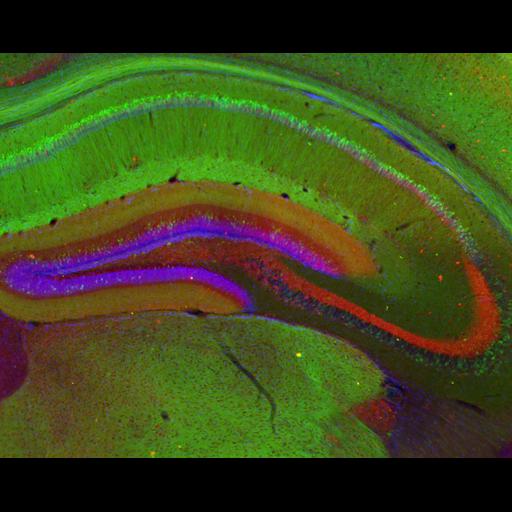
Distribution of hippocampal neurons expressing EGFP from the Nr4a1/Nur77 promoter (Tg(Nr4a1-EGFP)GY139Gsat, www.gensat.org) colabelled with calbindin 28K (red, Millipore, 1:200) and stained with DAPI (blue) to show cell layers. EGFP expression was amplified with chicken anti-GFP (Abcam, 1:2000). Calbindin 28K marks hippocampal interneuron cell bodies and some pyramidal cells in the cornus amonus (CA) regions but also labels the mossy fiber projections from the dentate granule cells to CA3. Nr4a1-EGFP is expressed primarily by CA1 pyramidal cells and to a lesser extent in CA3 pyramidal cells and sparse cells in the dentate gyrus. CA1 pyramidal cell dendrites are prominent in stratum radiatum while dense plexus is also present in the stratum lacunosum moleculare. Section (40 um) was mounted with Fluoromount G and imaged with a 5X, 0.15 NA Achroplan objective on a Zeiss Axiovert microscope. AF568 was excited at 562/40 nm and emission collected at 624/40 nm with Semrock filters and a single band dichroic (530-585 nm reflected, 601-800 nm transmitted). AF488 was excited at 482/35 nm and emission collected at 536/40 nm with Semrock filters and a single band dichroic (446-499 nm reflected, 513-735 nm transmitted). DAPI was excited at 350/50 nm and emission collected at 460/50 nm with a CLP400 dichroic (Chroma). Single images were captured for each channel using a Zeiss Axiocam MR CCD and pseudo-colored using Axiovision. Linear background subtraction was used on the presented image. See Davis and Puhl (2011), Pubmed ID 21305052 for a detailed staining protocol and images of EGFP expression in the striatum in this strain. This image is part of a series characterizing EGFP expression from the Nr4a1 promoter throughout the brain.
| Spatial Axis | Image Size | Pixel Size |
|---|---|---|
| X | 1300px | 2.03µm |
| Y | 1030px | 2.03µm |