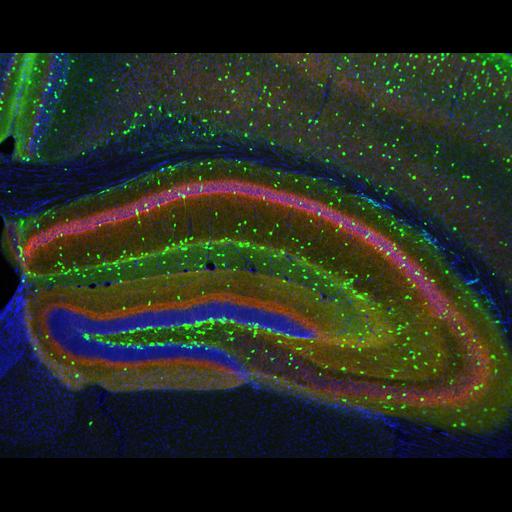
Distribution of interneurons expressing EGFP from the 5HT3 receptor promoter (Tg(Htr3a-EGFP)DH30Gsat, www.gensat.org) in the dorsal hippocampus colabelled for the CB1 cannabinoid receptor (red) and counterstained with DAPI (blue) to show the cell layers. EGFP expression was amplified with chicken anti-GFP (Abcam, 1:2000); cell bodies and fibers are present throughout all layers of the hippocampus but enriched in the hilus and stratum lacunosum moleculare (see associated images). CB1 immunoreactivity (L15 rabbit polyclonal 1:200, K. Mackie) is prominent in the terminals of basket cells synapsing in the pyramidal cell layer. CB1 is also enriched in axons with distinct intensities in the inner and outer molecular layer of the dentate gyrus. CB immunoreactivity is also present in the stratum radiatum and stratum lacunosum moleculare. Section (40 um) was mounted with Fluoromount G and imaged with a 5X, 0.15 NA Achroplan objective on a Zeiss Axiovert microscope. AF568 was excited at 562/40 nm and emission collected at 624/40 nm with Semrock filters and a single band dichroic (530-585 nm reflected, 601-800 nm transmitted). AF488 was excited at 482/35 nm and emission collected at 536/40 nm with Semrock filters and a single band dichroic (446-499 nm reflected, 513-735 nm transmitted). DAPI was excited at 350/50 nm and emission collected at 460/50 nm with a CLP400 dichroic (Chroma). Single images were captured for each channel using a Zeiss Axiocam MR CCD and pseudo-colored using Axiovision. Linear background subtraction was used on the presented image. See Davis and Puhl 2011 (Pubmed ID 21305052) for a detailed staining protocol. This image is part of a series characterizing EGFP expression from the 5HT3 promoter throughout the brain.
| Spatial Axis | Image Size | Pixel Size |
|---|---|---|
| X | 1300px | 2.03µm |
| Y | 1030px | 2.03µm |