Licensing
Description
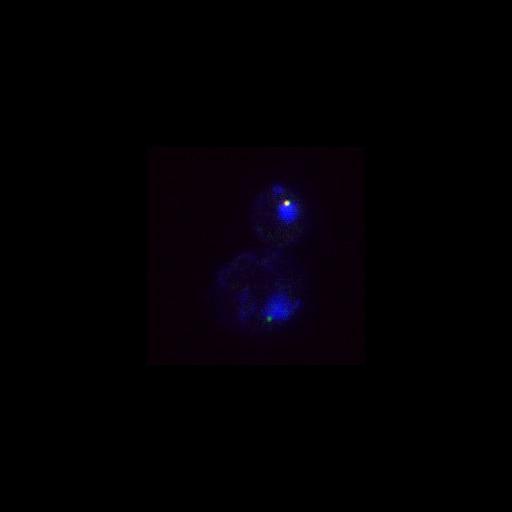
During late anaphase, Tem1 (green) localized to both spindle pole bodies (SPBs), but Bfa1 (red) was asymmetrically localized to the daughter SPB. DAPI (blue) and DIC (hidden) are also shown. Compare to metaphase image CIL# 13869. Image is Fig 6A, bottom panels, in J Cell Biol. (2011) 192: 599-614. Images in Fig 6 include CIL# 13869, 13868, 13871, 13870.
Technical Details
Cells (MATa tem1::TEM1-yEGFP::SpHIS5 bfa1::BFA1-mCherry-kanMX6) were fixed in 2.5% formaldehyde for 10 min, washed twice, and resuspended in 0.1 M potassium phosphate buffer, pH 6.4. Cells were then fixed for 10 min in 80% ethanol and resuspended in 1 mg/ml DAPI. Imaging was performed at 25C using a Leica DM6000 microscope equipped with a 100x/1.40 NA oil immersion objective lens, A4, L5, and TX2 filters, and a digital CCD camera (DFC350, Leica). Pictures were processed with LAS AF (Leica) and ImageJ software.
Biological Sources
- NCBI Organism Classification
- Saccharomyces cerevisiae
- (Baker's Yeast, Brewer's Yeast)
- Cell Line
- W303
- Cellular Component
- nucleus
- spindle pole body
- cytoskeleton
- cytoplasm
Biological Context
Attribution
- Names
- Mauricio Valerio-Santiago
- Fernando Monje-Casas
- Published
- J Cell Biol. (2011) 192: 599-614.
- Link
- http://jcb-dataviewer.rupress.org/jcb/...
- Pubmed
- 21321099
Grouping
This image is part of a group.Imaging
- Image Type
- recorded image
- Imaging Mode
- widefield illumination
- fluorescence microscopy
- differential interference contrast microscopy
- Parameters Imaged
- fluorescence emission
- optical path length gradient
- Source of Contrast
- distribution of a specific protein
- compartmentalization of stain or label
- boundaries between regions with different refractive index
- Visualization Methods
- EGFP
- 4',6-diamidino-2-phenylindole (DAPI)
- mCherryFP
- Processing History
- unprocessed raw data
- Data Qualifiers
- raw, unprocessed data
- suitable for spatial measurements
Sample Preparation
- Methods
- formaldehyde fixed tissue
- ethanol fixed tissue
- Relation To Intact Cell
- whole mounted tissue
Dimensions
| Spatial Axis | Image Size | Pixel Size |
|---|---|---|
| X | 218px | .0642μm |
| Y | 218px | .0642μm |