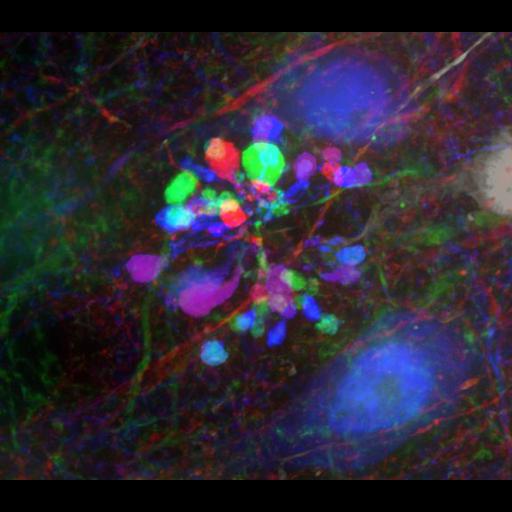
Section from rat brain cortex showing a subset of fluorescent-protein expressing neurons and microglia. Most prominent in this image is an aggregation of microglial cells surrounded by axons and dendrites coursing though the tissue section. The colors represent the Z-position in a maximum intensity projection of an image (compiled from 200 image planes, 0.1µm intervals), and were generated using the image processing package FIJI (http://pacific.mpi-cbg.de/wiki/index.php/Fiji). Neurons are expressing soluble YFP using the neuron-specific TH1 promoter. Microglia are expressing soluble GFP (transgene inserted in the Cx3cr1 locus). The z-stack source image (provided in this image group) was acquired with an iMIC Andromeda laser spinning disc confocal microscope (http://www.till-photonics.com/Products/andromeda.php), using an Olympus UPlanSApo 60X/NA1.35 objective, and: Andor Clara (Andor) CCD Camera. Both fluorophores were excited with a 488nm laser, and so are not distinguished from each other, with these filters: Laser CleanUp, FF01-446/523/600/677 (Semrock); Dichroic, zt405/490/561/640rpc (Chroma); Emission, FF01-390/482/563/640 (Semrock). .
| Spatial Axis | Image Size | Pixel Size |
|---|---|---|
| X | 576px | 0.107µm |
| Y | 504px | 0.107µm |