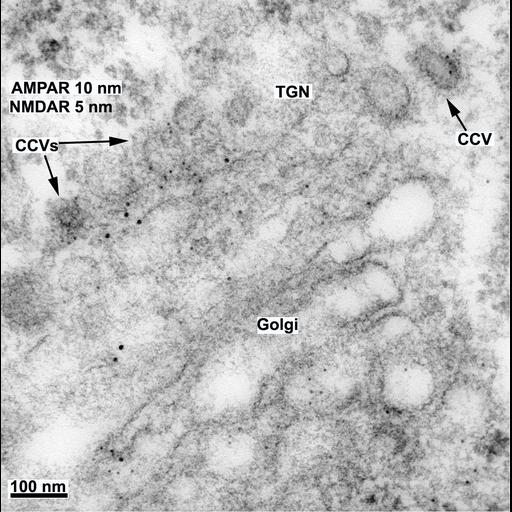
NMDA receptors (NMDARs) can exit the Golgi/TGN via clathrin-coated vesicles. Double-labeling using rabbit polyclonal antibodies to AMPA receptors (AMPARs) (combination of 3 antibodies: GluR1, GluR2, GluR2/3) and 10 nm immunogold, and mouse monoclonal antibodies to the NMDAR subunit NR1 (3 antibodies) and 5 nm immunogold, in a section of a neuron soma in the CA1 stratum pyramidale of the hippocampus from a P10 rat. In these studies, identification of 5 nm gold particles, where unclear, was confirmed by detailed examination and photography at higher magnifications. In the second image in the series, the micrograph is repeated and major structures are highlighted in color (green for membranous structures and clathrin coats; red for AMPAR-10 nm gold; blue for NR1-5 nm gold). Note that AMPA and NMDA receptor labeling is localized mainly separately in both the Golgi apparatus and trans-Golgi network (TGN), and NR1 is found alone in several clathrin-coated vesicles (CCVs) budding off of the TGN. Image is Fig1 from Wenthold, R.J., R.A. Al-Hallaq, C.C. Swanwick, and R.S. Petralia (2008) Molecular properties and cell biology of the NMDA receptor. In Structural and Functional Organization of the Synapse (J.W. Hell and M.E. Ehlers, eds.). Springer, NY, pp. 317-367.
| Spatial Axis | Image Size | Pixel Size |
|---|---|---|
| X | 1298px | 1.47nm |
| Y | 1308px | 1.47nm |