Alternate header for print version


Licensing
Attribution Non-Commercial; No Derivatives:This image is licensed under a Creative Commons Attribution, Non-Commercial, No Derivatives License. View License Deed | View Legal Code
tweet  
*CIL – Cell Image Library accession number. Please use this to reference an image.

CIL:11489*  Cite 
Description

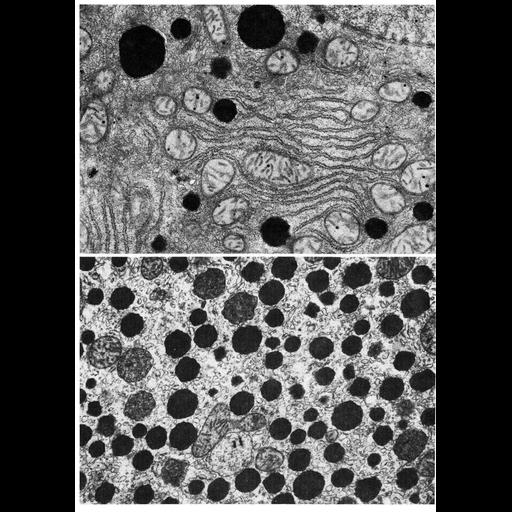
Figures 286 (upper) and 287 (lower) from Chapter 9 (Peroxisomes) of 'The Cell, 2nd Ed.' by Don W. Fawcett M.D. Peroxidase stained tissue from rat liver showing the normal size and distribution of peroxisomes (upper panel), and an increase in distribution following exposure to [4-chloro-6-(2.3-xylidine) 2-pyrimidinylthio] acetic acid (Wy-14643)(lower panel). Fig. 286 courtesy of Darius Fahimi; Fig. 287, courtesy of Janardan Reddy, from Reddy and Krishnakantha (1975) Science 190:787-9; PMID: 1198095. A PDF copy of the accompanying chapter is available on the ASCB’s BioEDUCATE website.

Biological Sources
NCBI Organism Classification
Rattus
Cell Type
hepatocyte
Cellular Component
peroxisome
cytoplasm
organelle
Biological Context
Biological Process
cellular catabolic process
cholesterol metabolic process
Attribution
Names
Don W. Fawcett
Darius Fahimi
Janardan Reddy
Published
ISBN 0721635849
Link
http://www.ascb.org/bioeducate/FawcettTheCell...
Citation
Digital Object Identifier (DOI)
doi:10.7295/W9CIL11489
Archival Resource Key (ARK)
ark:/b7295/w9cil11489
Grouping This image is part of a group.
Imaging
Image Type
transmission electron microscopy (TEM)
Image Mode
illumination by electrons
detection of electrons
Parameters Imaged
electron density
Source of Contrast
stain with broad specificity
Data Qualifiers
processed data
Sample Preparation
Methods
crosslinking-fixative fixed tissue
embedded tissue
Relation To Intact Cell
microtome-sectioned tissue
Dimensions
Spatial Axis Image Size Pixel Size
X 902px ——
Y 1280px ——