Alternate header for print version
Advanced search
Contributors
Help
Submit
Search
menu
Cell Process
Cell Component
Cell Type
Organism
Microbial
Alzheimer's
Data Sets
University of California, San Diego
9500 Gilman Drive
La Jolla, CA 92093-0608, USA
Voice
: (858) 534-0276
Fax
: (858) 534-7497
Email
: dorloff@ncmir.ucsd.edu
Grouped images - the images shown below are related
CIL:53076
NCBI Organism Classification
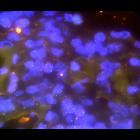
Homo sapiens
Biological Process
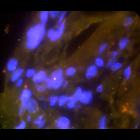
Copy number of hTERT, c-MYC, and SE7 determined by colored probes
Cellular Component
hTERT, c-MYC, and SE7 gene regions
Image 1, z=1 from SC_030
CIL:53077
NCBI Organism Classification
Homo sapiens
Biological Process
Copy number of hTERT, c-MYC, and SE7 determined by colored probes
Cellular Component
hTERT, c-MYC, and SE7 gene regions
Image 1, z=2 from SC_030
CIL:53078
NCBI Organism Classification
Homo sapiens
Biological Process
Copy number of hTERT, c-MYC, and SE7 determined by colored probes
Cellular Component
hTERT, c-MYC, and SE7 gene regions
Image 1, z=3 from SC_030
CIL:53079
NCBI Organism Classification
Homo sapiens
Biological Process
Copy number of hTERT, c-MYC, and SE7 determined by colored probes
Cellular Component
hTERT, c-MYC, and SE7 gene regions
Image 1, z=4 from SC_030
CIL:53080
NCBI Organism Classification
Homo sapiens
Biological Process
Copy number of hTERT, c-MYC, and SE7 determined by colored probes
Cellular Component
hTERT, c-MYC, and SE7 gene regions
Image 1, z=5 from SC_030
CIL:53081
NCBI Organism Classification
Homo sapiens
Biological Process
Copy number of hTERT, c-MYC, and SE7 determined by colored probes
Cellular Component
hTERT, c-MYC, and SE7 gene regions
Image 1, z=6 from SC_030
CIL:53082
NCBI Organism Classification
Homo sapiens
Biological Process
Copy number of hTERT, c-MYC, and SE7 determined by colored probes
Cellular Component
hTERT, c-MYC, and SE7 gene regions
Image 1, z=7 from SC_030
CIL:53083
NCBI Organism Classification
Homo sapiens
Biological Process
Copy number of hTERT, c-MYC, and SE7 determined by colored probes
Cellular Component
hTERT, c-MYC, and SE7 gene regions
Image 1, z=8 from SC_030
CIL:53084
NCBI Organism Classification
Homo sapiens
Biological Process
Copy number of hTERT, c-MYC, and SE7 determined by colored probes
Cellular Component
hTERT, c-MYC, and SE7 gene regions
Image 1, z=9 from SC_030
CIL:53085
NCBI Organism Classification
Homo sapiens
Biological Process
Copy number of hTERT, c-MYC, and SE7 determined by colored probes
Cellular Component
hTERT, c-MYC, and SE7 gene regions
Image 1, z=10 from SC_030
CIL:53086
NCBI Organism Classification
Homo sapiens
Biological Process
Copy number of hTERT, c-MYC, and SE7 determined by colored probes
Cellular Component
hTERT, c-MYC, and SE7 gene regions
Image 1, z=11 from SC_030
CIL:53087
NCBI Organism Classification
Homo sapiens
Biological Process
Copy number of hTERT, c-MYC, and SE7 determined by colored probes
Cellular Component
hTERT, c-MYC, and SE7 gene regions
Image 1, z=12 from SC_030
CIL:53088
NCBI Organism Classification
Homo sapiens
Biological Process
Copy number of hTERT, c-MYC, and SE7 determined by colored probes
Cellular Component
hTERT, c-MYC, and SE7 gene regions
Image 1, z=13 from SC_030
CIL:53089
NCBI Organism Classification
Homo sapiens
Biological Process
Copy number of hTERT, c-MYC, and SE7 determined by colored probes
Cellular Component
hTERT, c-MYC, and SE7 gene regions
Image 1, z=14 from SC_030
CIL:53090
NCBI Organism Classification
Homo sapiens
Biological Process
Copy number of hTERT, c-MYC, and SE7 determined by colored probes
Cellular Component
hTERT, c-MYC, and SE7 gene regions
Image 1, z=15 from SC_030
CIL:53091
NCBI Organism Classification
Homo sapiens
Biological Process
Copy number of hTERT, c-MYC, and SE7 determined by colored probes
Cellular Component
hTERT, c-MYC, and SE7 gene regions
Image 1, z=16 from SC_030
CIL:53092
NCBI Organism Classification
Homo sapiens
Biological Process
Copy number of hTERT, c-MYC, and SE7 determined by colored probes
Cellular Component
hTERT, c-MYC, and SE7 gene regions
Image 1, z=17 from SC_030
CIL:53093
NCBI Organism Classification
Homo sapiens
Biological Process
Copy number of hTERT, c-MYC, and SE7 determined by colored probes
Cellular Component
hTERT, c-MYC, and SE7 gene regions
Image 1, z=18 from SC_030
CIL:53094
NCBI Organism Classification
Homo sapiens
Biological Process
Copy number of hTERT, c-MYC, and SE7 determined by colored probes
Cellular Component
hTERT, c-MYC, and SE7 gene regions
Image 1, z=19 from SC_030
CIL:53095
NCBI Organism Classification
Homo sapiens
Biological Process
Copy number of hTERT, c-MYC, and SE7 determined by colored probes
Cellular Component
hTERT, c-MYC, and SE7 gene regions
Image 1, z=20 from SC_030
CIL:53096
NCBI Organism Classification
Homo sapiens
Biological Process
Copy number of hTERT, c-MYC, and SE7 determined by colored probes
Cellular Component
hTERT, c-MYC, and SE7 gene regions
Image 1, z=21 from SC_030
CIL:53097
NCBI Organism Classification
Homo sapiens
Biological Process
Copy number of hTERT, c-MYC, and SE7 determined by colored probes
Cellular Component
hTERT, c-MYC, and SE7 gene regions
Image 2, z=1 from SC_030
CIL:53098
NCBI Organism Classification
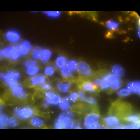
Homo sapiens
Biological Process
Copy number of hTERT, c-MYC, and SE7 determined by colored probes
Cellular Component
hTERT, c-MYC, and SE7 gene regions
Image 2, z=2 from SC_030
CIL:53099
NCBI Organism Classification
Homo sapiens
Biological Process
Copy number of hTERT, c-MYC, and SE7 determined by colored probes
Cellular Component
hTERT, c-MYC, and SE7 gene regions
Image 2, z=3 from SC_030
CIL:53100
NCBI Organism Classification
Homo sapiens
Biological Process
Copy number of hTERT, c-MYC, and SE7 determined by colored probes
Cellular Component
hTERT, c-MYC, and SE7 gene regions
Image 2, z=4 from SC_030
CIL:53101
NCBI Organism Classification
Homo sapiens
Biological Process
Copy number of hTERT, c-MYC, and SE7 determined by colored probes
Cellular Component
hTERT, c-MYC, and SE7 gene regions
Image 2, z=5 from SC_030
CIL:53102
NCBI Organism Classification
Homo sapiens
Biological Process
Copy number of hTERT, c-MYC, and SE7 determined by colored probes
Cellular Component
hTERT, c-MYC, and SE7 gene regions
Image 2, z=6 from SC_030
CIL:53103
NCBI Organism Classification
Homo sapiens
Biological Process
Copy number of hTERT, c-MYC, and SE7 determined by colored probes
Cellular Component
hTERT, c-MYC, and SE7 gene regions
Image 2, z=7 from SC_030
CIL:53104
NCBI Organism Classification
Homo sapiens
Biological Process
Copy number of hTERT, c-MYC, and SE7 determined by colored probes
Cellular Component
hTERT, c-MYC, and SE7 gene regions
Image 2, z=8 from SC_030
CIL:53105
NCBI Organism Classification
Homo sapiens
Biological Process
Copy number of hTERT, c-MYC, and SE7 determined by colored probes
Cellular Component
hTERT, c-MYC, and SE7 gene regions
Image 2, z=9 from SC_030
CIL:53106
NCBI Organism Classification
Homo sapiens
Biological Process
Copy number of hTERT, c-MYC, and SE7 determined by colored probes
Cellular Component
hTERT, c-MYC, and SE7 gene regions
Image 2, z=10 from SC_030
CIL:53107
NCBI Organism Classification
Homo sapiens
Biological Process
Copy number of hTERT, c-MYC, and SE7 determined by colored probes
Cellular Component
hTERT, c-MYC, and SE7 gene regions
Image 2, z=11 from SC_030
CIL:53108
NCBI Organism Classification
Homo sapiens
Biological Process
Copy number of hTERT, c-MYC, and SE7 determined by colored probes
Cellular Component
hTERT, c-MYC, and SE7 gene regions
Image 2, z=12 from SC_030
CIL:53109
NCBI Organism Classification
Homo sapiens
Biological Process
Copy number of hTERT, c-MYC, and SE7 determined by colored probes
Cellular Component
hTERT, c-MYC, and SE7 gene regions
Image 2, z=13 from SC_030
CIL:53110
NCBI Organism Classification
Homo sapiens
Biological Process
Copy number of hTERT, c-MYC, and SE7 determined by colored probes
Cellular Component
hTERT, c-MYC, and SE7 gene regions
Image 2, z=14 from SC_030
CIL:53111
NCBI Organism Classification
Homo sapiens
Biological Process
Copy number of hTERT, c-MYC, and SE7 determined by colored probes
Cellular Component
hTERT, c-MYC, and SE7 gene regions
Image 2, z=15 from SC_030
CIL:53112
NCBI Organism Classification
Homo sapiens
Biological Process
Copy number of hTERT, c-MYC, and SE7 determined by colored probes
Cellular Component
hTERT, c-MYC, and SE7 gene regions
Image 2, z=16 from SC_030
CIL:53113
NCBI Organism Classification
Homo sapiens
Biological Process
Copy number of hTERT, c-MYC, and SE7 determined by colored probes
Cellular Component
hTERT, c-MYC, and SE7 gene regions
Image 2, z=17 from SC_030
CIL:53114
NCBI Organism Classification
Homo sapiens
Biological Process
Copy number of hTERT, c-MYC, and SE7 determined by colored probes
Cellular Component
hTERT, c-MYC, and SE7 gene regions
Image 2, z=18 from SC_030
CIL:53115
NCBI Organism Classification
Homo sapiens
Biological Process
Copy number of hTERT, c-MYC, and SE7 determined by colored probes
Cellular Component
hTERT, c-MYC, and SE7 gene regions
Image 2, z=19 from SC_030
CIL:53116
NCBI Organism Classification
Homo sapiens
Biological Process
Copy number of hTERT, c-MYC, and SE7 determined by colored probes
Cellular Component
hTERT, c-MYC, and SE7 gene regions
Image 2, z=20 from SC_030
CIL:53117
NCBI Organism Classification
Homo sapiens
Biological Process
Copy number of hTERT, c-MYC, and SE7 determined by colored probes
Cellular Component
hTERT, c-MYC, and SE7 gene regions
Image 2, z=21 from SC_030
CIL:53118
NCBI Organism Classification
Homo sapiens
Biological Process
Copy number of hTERT, c-MYC, and SE7 determined by colored probes
Cellular Component
hTERT, c-MYC, and SE7 gene regions
Image 3, z=1 from SC_030
CIL:53119
NCBI Organism Classification
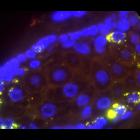
Homo sapiens
Biological Process
Copy number of hTERT, c-MYC, and SE7 determined by colored probes
Cellular Component
hTERT, c-MYC, and SE7 gene regions
Image 3, z=2 from SC_030
CIL:53120
NCBI Organism Classification
Homo sapiens
Biological Process
Copy number of hTERT, c-MYC, and SE7 determined by colored probes
Cellular Component
hTERT, c-MYC, and SE7 gene regions
Image 3, z=3 from SC_030
CIL:53121
NCBI Organism Classification
Homo sapiens
Biological Process
Copy number of hTERT, c-MYC, and SE7 determined by colored probes
Cellular Component
hTERT, c-MYC, and SE7 gene regions
Image 3, z=4 from SC_030
CIL:53122
NCBI Organism Classification
Homo sapiens
Biological Process
Copy number of hTERT, c-MYC, and SE7 determined by colored probes
Cellular Component
hTERT, c-MYC, and SE7 gene regions
Image 3, z=5 from SC_030
CIL:53123
NCBI Organism Classification
Homo sapiens
Biological Process
Copy number of hTERT, c-MYC, and SE7 determined by colored probes
Cellular Component
hTERT, c-MYC, and SE7 gene regions
Image 3, z=6 from SC_030
CIL:53124
NCBI Organism Classification
Homo sapiens
Biological Process
Copy number of hTERT, c-MYC, and SE7 determined by colored probes
Cellular Component
hTERT, c-MYC, and SE7 gene regions
Image 3, z=7 from SC_030
CIL:53125
NCBI Organism Classification
Homo sapiens
Biological Process
Copy number of hTERT, c-MYC, and SE7 determined by colored probes
Cellular Component
hTERT, c-MYC, and SE7 gene regions
Image 3, z=8 from SC_030
CIL:53126
NCBI Organism Classification
Homo sapiens
Biological Process
Copy number of hTERT, c-MYC, and SE7 determined by colored probes
Cellular Component
hTERT, c-MYC, and SE7 gene regions
Image 3, z=9 from SC_030
CIL:53127
NCBI Organism Classification
Homo sapiens
Biological Process
Copy number of hTERT, c-MYC, and SE7 determined by colored probes
Cellular Component
hTERT, c-MYC, and SE7 gene regions
Image 3, z=10 from SC_030
CIL:53128
NCBI Organism Classification
Homo sapiens
Biological Process
Copy number of hTERT, c-MYC, and SE7 determined by colored probes
Cellular Component
hTERT, c-MYC, and SE7 gene regions
Image 3, z=11 from SC_030
CIL:53129
NCBI Organism Classification
Homo sapiens
Biological Process
Copy number of hTERT, c-MYC, and SE7 determined by colored probes
Cellular Component
hTERT, c-MYC, and SE7 gene regions
Image 3, z=12 from SC_030
CIL:53130
NCBI Organism Classification
Homo sapiens
Biological Process
Copy number of hTERT, c-MYC, and SE7 determined by colored probes
Cellular Component
hTERT, c-MYC, and SE7 gene regions
Image 3, z=13 from SC_030
CIL:53131
NCBI Organism Classification
Homo sapiens
Biological Process
Copy number of hTERT, c-MYC, and SE7 determined by colored probes
Cellular Component
hTERT, c-MYC, and SE7 gene regions
Image 3, z=14 from SC_030
CIL:53132
NCBI Organism Classification
Homo sapiens
Biological Process
Copy number of hTERT, c-MYC, and SE7 determined by colored probes
Cellular Component
hTERT, c-MYC, and SE7 gene regions
Image 3, z=15 from SC_030
CIL:53133
NCBI Organism Classification
Homo sapiens
Biological Process
Copy number of hTERT, c-MYC, and SE7 determined by colored probes
Cellular Component
hTERT, c-MYC, and SE7 gene regions
Image 3, z=16 from SC_030
CIL:53134
NCBI Organism Classification
Homo sapiens
Biological Process
Copy number of hTERT, c-MYC, and SE7 determined by colored probes
Cellular Component
hTERT, c-MYC, and SE7 gene regions
Image 3, z=17 from SC_030
CIL:53135
NCBI Organism Classification
Homo sapiens
Biological Process
Copy number of hTERT, c-MYC, and SE7 determined by colored probes
Cellular Component
hTERT, c-MYC, and SE7 gene regions
Image 3, z=18 from SC_030
CIL:53136
NCBI Organism Classification
Homo sapiens
Biological Process
Copy number of hTERT, c-MYC, and SE7 determined by colored probes
Cellular Component
hTERT, c-MYC, and SE7 gene regions
Image 3, z=19 from SC_030
CIL:53137
NCBI Organism Classification
Homo sapiens
Biological Process
Copy number of hTERT, c-MYC, and SE7 determined by colored probes
Cellular Component
hTERT, c-MYC, and SE7 gene regions
Image 3, z=20 from SC_030
CIL:53138
NCBI Organism Classification
Homo sapiens
Biological Process
Copy number of hTERT, c-MYC, and SE7 determined by colored probes
Cellular Component
hTERT, c-MYC, and SE7 gene regions
Image 3, z=21 from SC_030
CIL:53139
NCBI Organism Classification
Homo sapiens
Biological Process
Copy number of hTERT, c-MYC, and SE7 determined by colored probes
Cellular Component
hTERT, c-MYC, and SE7 gene regions
Image 4, z=1 from SC_030
CIL:53140
NCBI Organism Classification
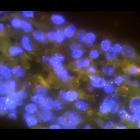
Homo sapiens
Biological Process
Copy number of hTERT, c-MYC, and SE7 determined by colored probes
Cellular Component
hTERT, c-MYC, and SE7 gene regions
Image 4, z=2 from SC_030
CIL:53141
NCBI Organism Classification
Homo sapiens
Biological Process
Copy number of hTERT, c-MYC, and SE7 determined by colored probes
Cellular Component
hTERT, c-MYC, and SE7 gene regions
Image 4, z=3 from SC_030
CIL:53142
NCBI Organism Classification
Homo sapiens
Biological Process
Copy number of hTERT, c-MYC, and SE7 determined by colored probes
Cellular Component
hTERT, c-MYC, and SE7 gene regions
Image 4, z=4 from SC_030
CIL:53143
NCBI Organism Classification
Homo sapiens
Biological Process
Copy number of hTERT, c-MYC, and SE7 determined by colored probes
Cellular Component
hTERT, c-MYC, and SE7 gene regions
Image 4, z=5 from SC_030
CIL:53144
NCBI Organism Classification
Homo sapiens
Biological Process
Copy number of hTERT, c-MYC, and SE7 determined by colored probes
Cellular Component
hTERT, c-MYC, and SE7 gene regions
Image 4, z=6 from SC_030
CIL:53145
NCBI Organism Classification
Homo sapiens
Biological Process
Copy number of hTERT, c-MYC, and SE7 determined by colored probes
Cellular Component
hTERT, c-MYC, and SE7 gene regions
Image 4, z=7 from SC_030
CIL:53146
NCBI Organism Classification
Homo sapiens
Biological Process
Copy number of hTERT, c-MYC, and SE7 determined by colored probes
Cellular Component
hTERT, c-MYC, and SE7 gene regions
Image 4, z=8 from SC_030
CIL:53147
NCBI Organism Classification
Homo sapiens
Biological Process
Copy number of hTERT, c-MYC, and SE7 determined by colored probes
Cellular Component
hTERT, c-MYC, and SE7 gene regions
Image 4, z=9 from SC_030
CIL:53148
NCBI Organism Classification
Homo sapiens
Biological Process
Copy number of hTERT, c-MYC, and SE7 determined by colored probes
Cellular Component
hTERT, c-MYC, and SE7 gene regions
Image 4, z=10 from SC_030
CIL:53149
NCBI Organism Classification
Homo sapiens
Biological Process
Copy number of hTERT, c-MYC, and SE7 determined by colored probes
Cellular Component
hTERT, c-MYC, and SE7 gene regions
Image 4, z=11 from SC_030
CIL:53150
NCBI Organism Classification
Homo sapiens
Biological Process
Copy number of hTERT, c-MYC, and SE7 determined by colored probes
Cellular Component
hTERT, c-MYC, and SE7 gene regions
Image 4, z=12 from SC_030
CIL:53151
NCBI Organism Classification
Homo sapiens
Biological Process
Copy number of hTERT, c-MYC, and SE7 determined by colored probes
Cellular Component
hTERT, c-MYC, and SE7 gene regions
Image 4, z=13 from SC_030
CIL:53152
NCBI Organism Classification
Homo sapiens
Biological Process
Copy number of hTERT, c-MYC, and SE7 determined by colored probes
Cellular Component
hTERT, c-MYC, and SE7 gene regions
Image 4, z=14 from SC_030
CIL:53153
NCBI Organism Classification
Homo sapiens
Biological Process
Copy number of hTERT, c-MYC, and SE7 determined by colored probes
Cellular Component
hTERT, c-MYC, and SE7 gene regions
Image 4, z=15 from SC_030
CIL:53154
NCBI Organism Classification
Homo sapiens
Biological Process
Copy number of hTERT, c-MYC, and SE7 determined by colored probes
Cellular Component
hTERT, c-MYC, and SE7 gene regions
Image 4, z=16 from SC_030
CIL:53155
NCBI Organism Classification
Homo sapiens
Biological Process
Copy number of hTERT, c-MYC, and SE7 determined by colored probes
Cellular Component
hTERT, c-MYC, and SE7 gene regions
Image 4, z=17 from SC_030
CIL:53156
NCBI Organism Classification
Homo sapiens
Biological Process
Copy number of hTERT, c-MYC, and SE7 determined by colored probes
Cellular Component
hTERT, c-MYC, and SE7 gene regions
Image 4, z=18 from SC_030
CIL:53157
NCBI Organism Classification
Homo sapiens
Biological Process
Copy number of hTERT, c-MYC, and SE7 determined by colored probes
Cellular Component
hTERT, c-MYC, and SE7 gene regions
Image 4, z=19 from SC_030
CIL:53158
NCBI Organism Classification
Homo sapiens
Biological Process
Copy number of hTERT, c-MYC, and SE7 determined by colored probes
Cellular Component
hTERT, c-MYC, and SE7 gene regions
Image 4, z=20 from SC_030
CIL:53159
NCBI Organism Classification
Homo sapiens
Biological Process
Copy number of hTERT, c-MYC, and SE7 determined by colored probes
Cellular Component
hTERT, c-MYC, and SE7 gene regions
Image 4, z=21 from SC_030
CIL:53160
NCBI Organism Classification
Homo sapiens
Biological Process
Copy number of hTERT, c-MYC, and SE7 determined by colored probes
Cellular Component
hTERT, c-MYC, and SE7 gene regions
Image 5, z=1 from SC_030
CIL:53161
NCBI Organism Classification
Homo sapiens
Biological Process
Copy number of hTERT, c-MYC, and SE7 determined by colored probes
Cellular Component
hTERT, c-MYC, and SE7 gene regions
Image 5, z=2 from SC_030
CIL:53162
NCBI Organism Classification
Homo sapiens
Biological Process
Copy number of hTERT, c-MYC, and SE7 determined by colored probes
Cellular Component
hTERT, c-MYC, and SE7 gene regions
Image 5, z=3 from SC_030
CIL:53163
NCBI Organism Classification
Homo sapiens
Biological Process
Copy number of hTERT, c-MYC, and SE7 determined by colored probes
Cellular Component
hTERT, c-MYC, and SE7 gene regions
Image 5, z=4 from SC_030
CIL:53164
NCBI Organism Classification
Homo sapiens
Biological Process
Copy number of hTERT, c-MYC, and SE7 determined by colored probes
Cellular Component
hTERT, c-MYC, and SE7 gene regions
Image 5, z=5 from SC_030
CIL:53165
NCBI Organism Classification
Homo sapiens
Biological Process
Copy number of hTERT, c-MYC, and SE7 determined by colored probes
Cellular Component
hTERT, c-MYC, and SE7 gene regions
Image 5, z=6 from SC_030
CIL:53166
NCBI Organism Classification
Homo sapiens
Biological Process
Copy number of hTERT, c-MYC, and SE7 determined by colored probes
Cellular Component
hTERT, c-MYC, and SE7 gene regions
Image 5, z=7 from SC_030
CIL:53167
NCBI Organism Classification
Homo sapiens
Biological Process
Copy number of hTERT, c-MYC, and SE7 determined by colored probes
Cellular Component
hTERT, c-MYC, and SE7 gene regions
Image 5, z=8 from SC_030
CIL:53168
NCBI Organism Classification
Homo sapiens
Biological Process
Copy number of hTERT, c-MYC, and SE7 determined by colored probes
Cellular Component
hTERT, c-MYC, and SE7 gene regions
Image 5, z=9 from SC_030
CIL:53169
NCBI Organism Classification
Homo sapiens
Biological Process
Copy number of hTERT, c-MYC, and SE7 determined by colored probes
Cellular Component
hTERT, c-MYC, and SE7 gene regions
Image 5, z=10 from SC_030
CIL:53170
NCBI Organism Classification
Homo sapiens
Biological Process
Copy number of hTERT, c-MYC, and SE7 determined by colored probes
Cellular Component
hTERT, c-MYC, and SE7 gene regions
Image 5, z=11 from SC_030
CIL:53171
NCBI Organism Classification
Homo sapiens
Biological Process
Copy number of hTERT, c-MYC, and SE7 determined by colored probes
Cellular Component
hTERT, c-MYC, and SE7 gene regions
Image 5, z=12 from SC_030
CIL:53172
NCBI Organism Classification
Homo sapiens
Biological Process
Copy number of hTERT, c-MYC, and SE7 determined by colored probes
Cellular Component
hTERT, c-MYC, and SE7 gene regions
Image 5, z=13 from SC_030
CIL:53173
NCBI Organism Classification
Homo sapiens
Biological Process
Copy number of hTERT, c-MYC, and SE7 determined by colored probes
Cellular Component
hTERT, c-MYC, and SE7 gene regions
Image 5, z=14 from SC_030
CIL:53174
NCBI Organism Classification
Homo sapiens
Biological Process
Copy number of hTERT, c-MYC, and SE7 determined by colored probes
Cellular Component
hTERT, c-MYC, and SE7 gene regions
Image 5, z=15 from SC_030
CIL:53175
NCBI Organism Classification
Homo sapiens
Biological Process
Copy number of hTERT, c-MYC, and SE7 determined by colored probes
Cellular Component
hTERT, c-MYC, and SE7 gene regions
Image 5, z=16 from SC_030
CIL:53176
NCBI Organism Classification
Homo sapiens
Biological Process
Copy number of hTERT, c-MYC, and SE7 determined by colored probes
Cellular Component
hTERT, c-MYC, and SE7 gene regions
Image 5, z=17 from SC_030
CIL:53177
NCBI Organism Classification
Homo sapiens
Biological Process
Copy number of hTERT, c-MYC, and SE7 determined by colored probes
Cellular Component
hTERT, c-MYC, and SE7 gene regions
Image 5, z=18 from SC_030
CIL:53178
NCBI Organism Classification
Homo sapiens
Biological Process
Copy number of hTERT, c-MYC, and SE7 determined by colored probes
Cellular Component
hTERT, c-MYC, and SE7 gene regions
Image 5, z=19 from SC_030
CIL:53179
NCBI Organism Classification
Homo sapiens
Biological Process
Copy number of hTERT, c-MYC, and SE7 determined by colored probes
Cellular Component
hTERT, c-MYC, and SE7 gene regions
Image 5, z=20 from SC_030
CIL:53180
NCBI Organism Classification
Homo sapiens
Biological Process
Copy number of hTERT, c-MYC, and SE7 determined by colored probes
Cellular Component
hTERT, c-MYC, and SE7 gene regions
Image 5, z=21 from SC_030

")