Alternate header for print version
Advanced search
Contributors
Help
Submit
Search
menu
Cell Process
Cell Component
Cell Type
Organism
Microbial
Alzheimer's
Data Sets
University of California, San Diego
9500 Gilman Drive
La Jolla, CA 92093-0608, USA
Voice
: (858) 534-0276
Fax
: (858) 534-7497
Email
: dorloff@ncmir.ucsd.edu
Grouped images - the images shown below are related
CIL:52992
NCBI Organism Classification
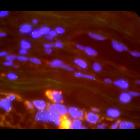
Homo sapiens
Biological Process
Copy number of hTERT, c-MYC, and SE7 determined by colored probes
Cellular Component
hTERT, c-MYC, and SE7 gene regions
Image 1, z=1 from SC_028
CIL:52993
NCBI Organism Classification
Homo sapiens
Biological Process
Copy number of hTERT, c-MYC, and SE7 determined by colored probes
Cellular Component
hTERT, c-MYC, and SE7 gene regions
Image 1, z=2 from SC_028
CIL:52994
NCBI Organism Classification
Homo sapiens
Biological Process
Copy number of hTERT, c-MYC, and SE7 determined by colored probes
Cellular Component
hTERT, c-MYC, and SE7 gene regions
Image 1, z=3 from SC_028
CIL:52995
NCBI Organism Classification
Homo sapiens
Biological Process
Copy number of hTERT, c-MYC, and SE7 determined by colored probes
Cellular Component
hTERT, c-MYC, and SE7 gene regions
Image 1, z=4 from SC_028
CIL:52996
NCBI Organism Classification
Homo sapiens
Biological Process
Copy number of hTERT, c-MYC, and SE7 determined by colored probes
Cellular Component
hTERT, c-MYC, and SE7 gene regions
Image 1, z=5 from SC_028
CIL:52997
NCBI Organism Classification
Homo sapiens
Biological Process
Copy number of hTERT, c-MYC, and SE7 determined by colored probes
Cellular Component
hTERT, c-MYC, and SE7 gene regions
Image 1, z=6 from SC_028
CIL:52998
NCBI Organism Classification
Homo sapiens
Biological Process
Copy number of hTERT, c-MYC, and SE7 determined by colored probes
Cellular Component
hTERT, c-MYC, and SE7 gene regions
Image 1, z=7 from SC_028
CIL:52999
NCBI Organism Classification
Homo sapiens
Biological Process
Copy number of hTERT, c-MYC, and SE7 determined by colored probes
Cellular Component
hTERT, c-MYC, and SE7 gene regions
Image 1, z=8 from SC_028
CIL:53000
NCBI Organism Classification
Homo sapiens
Biological Process
Copy number of hTERT, c-MYC, and SE7 determined by colored probes
Cellular Component
hTERT, c-MYC, and SE7 gene regions
Image 1, z=9 from SC_028
CIL:53001
NCBI Organism Classification
Homo sapiens
Biological Process
Copy number of hTERT, c-MYC, and SE7 determined by colored probes
Cellular Component
hTERT, c-MYC, and SE7 gene regions
Image 1, z=10 from SC_028
CIL:53002
NCBI Organism Classification
Homo sapiens
Biological Process
Copy number of hTERT, c-MYC, and SE7 determined by colored probes
Cellular Component
hTERT, c-MYC, and SE7 gene regions
Image 1, z=11 from SC_028
CIL:53003
NCBI Organism Classification
Homo sapiens
Biological Process
Copy number of hTERT, c-MYC, and SE7 determined by colored probes
Cellular Component
hTERT, c-MYC, and SE7 gene regions
Image 1, z=12 from SC_028
CIL:53004
NCBI Organism Classification
Homo sapiens
Biological Process
Copy number of hTERT, c-MYC, and SE7 determined by colored probes
Cellular Component
hTERT, c-MYC, and SE7 gene regions
Image 1, z=13 from SC_028
CIL:53005
NCBI Organism Classification
Homo sapiens
Biological Process
Copy number of hTERT, c-MYC, and SE7 determined by colored probes
Cellular Component
hTERT, c-MYC, and SE7 gene regions
Image 1, z=14 from SC_028
CIL:53006
NCBI Organism Classification
Homo sapiens
Biological Process
Copy number of hTERT, c-MYC, and SE7 determined by colored probes
Cellular Component
hTERT, c-MYC, and SE7 gene regions
Image 1, z=15 from SC_028
CIL:53007
NCBI Organism Classification
Homo sapiens
Biological Process
Copy number of hTERT, c-MYC, and SE7 determined by colored probes
Cellular Component
hTERT, c-MYC, and SE7 gene regions
Image 1, z=16 from SC_028
CIL:53008
NCBI Organism Classification
Homo sapiens
Biological Process
Copy number of hTERT, c-MYC, and SE7 determined by colored probes
Cellular Component
hTERT, c-MYC, and SE7 gene regions
Image 1, z=17 from SC_028
CIL:53009
NCBI Organism Classification
Homo sapiens
Biological Process
Copy number of hTERT, c-MYC, and SE7 determined by colored probes
Cellular Component
hTERT, c-MYC, and SE7 gene regions
Image 1, z=18 from SC_028
CIL:53010
NCBI Organism Classification
Homo sapiens
Biological Process
Copy number of hTERT, c-MYC, and SE7 determined by colored probes
Cellular Component
hTERT, c-MYC, and SE7 gene regions
Image 1, z=19 from SC_028
CIL:53011
NCBI Organism Classification
Homo sapiens
Biological Process
Copy number of hTERT, c-MYC, and SE7 determined by colored probes
Cellular Component
hTERT, c-MYC, and SE7 gene regions
Image 1, z=20 from SC_028
CIL:53012
NCBI Organism Classification
Homo sapiens
Biological Process
Copy number of hTERT, c-MYC, and SE7 determined by colored probes
Cellular Component
hTERT, c-MYC, and SE7 gene regions
Image 1, z=21 from SC_028
CIL:53013
NCBI Organism Classification
Homo sapiens
Biological Process
Copy number of hTERT, c-MYC, and SE7 determined by colored probes
Cellular Component
hTERT, c-MYC, and SE7 gene regions
Image 2, z=1 from SC_028
CIL:53014
NCBI Organism Classification
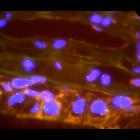
Homo sapiens
Biological Process
Copy number of hTERT, c-MYC, and SE7 determined by colored probes
Cellular Component
hTERT, c-MYC, and SE7 gene regions
Image 2, z=2 from SC_028
CIL:53015
NCBI Organism Classification
Homo sapiens
Biological Process
Copy number of hTERT, c-MYC, and SE7 determined by colored probes
Cellular Component
hTERT, c-MYC, and SE7 gene regions
Image 2, z=3 from SC_028
CIL:53016
NCBI Organism Classification
Homo sapiens
Biological Process
Copy number of hTERT, c-MYC, and SE7 determined by colored probes
Cellular Component
hTERT, c-MYC, and SE7 gene regions
Image 2, z=4 from SC_028
CIL:53017
NCBI Organism Classification
Homo sapiens
Biological Process
Copy number of hTERT, c-MYC, and SE7 determined by colored probes
Cellular Component
hTERT, c-MYC, and SE7 gene regions
Image 2, z=5 from SC_028
CIL:53018
NCBI Organism Classification
Homo sapiens
Biological Process
Copy number of hTERT, c-MYC, and SE7 determined by colored probes
Cellular Component
hTERT, c-MYC, and SE7 gene regions
Image 2, z=6 from SC_028
CIL:53019
NCBI Organism Classification
Homo sapiens
Biological Process
Copy number of hTERT, c-MYC, and SE7 determined by colored probes
Cellular Component
hTERT, c-MYC, and SE7 gene regions
Image 2, z=7 from SC_028
CIL:53020
NCBI Organism Classification
Homo sapiens
Biological Process
Copy number of hTERT, c-MYC, and SE7 determined by colored probes
Cellular Component
hTERT, c-MYC, and SE7 gene regions
Image 2, z=8 from SC_028
CIL:53021
NCBI Organism Classification
Homo sapiens
Biological Process
Copy number of hTERT, c-MYC, and SE7 determined by colored probes
Cellular Component
hTERT, c-MYC, and SE7 gene regions
Image 2, z=9 from SC_028
CIL:53022
NCBI Organism Classification
Homo sapiens
Biological Process
Copy number of hTERT, c-MYC, and SE7 determined by colored probes
Cellular Component
hTERT, c-MYC, and SE7 gene regions
Image 2, z=10 from SC_028
CIL:53023
NCBI Organism Classification
Homo sapiens
Biological Process
Copy number of hTERT, c-MYC, and SE7 determined by colored probes
Cellular Component
hTERT, c-MYC, and SE7 gene regions
Image 2, z=11 from SC_028
CIL:53024
NCBI Organism Classification
Homo sapiens
Biological Process
Copy number of hTERT, c-MYC, and SE7 determined by colored probes
Cellular Component
hTERT, c-MYC, and SE7 gene regions
Image 2, z=12 from SC_028
CIL:53025
NCBI Organism Classification
Homo sapiens
Biological Process
Copy number of hTERT, c-MYC, and SE7 determined by colored probes
Cellular Component
hTERT, c-MYC, and SE7 gene regions
Image 2, z=13 from SC_028
CIL:53026
NCBI Organism Classification
Homo sapiens
Biological Process
Copy number of hTERT, c-MYC, and SE7 determined by colored probes
Cellular Component
hTERT, c-MYC, and SE7 gene regions
Image 2, z=14 from SC_028
CIL:53027
NCBI Organism Classification
Homo sapiens
Biological Process
Copy number of hTERT, c-MYC, and SE7 determined by colored probes
Cellular Component
hTERT, c-MYC, and SE7 gene regions
Image 2, z=15 from SC_028
CIL:53028
NCBI Organism Classification
Homo sapiens
Biological Process
Copy number of hTERT, c-MYC, and SE7 determined by colored probes
Cellular Component
hTERT, c-MYC, and SE7 gene regions
Image 2, z=16 from SC_028
CIL:53029
NCBI Organism Classification
Homo sapiens
Biological Process
Copy number of hTERT, c-MYC, and SE7 determined by colored probes
Cellular Component
hTERT, c-MYC, and SE7 gene regions
Image 2, z=17 from SC_028
CIL:53030
NCBI Organism Classification
Homo sapiens
Biological Process
Copy number of hTERT, c-MYC, and SE7 determined by colored probes
Cellular Component
hTERT, c-MYC, and SE7 gene regions
Image 2, z=18 from SC_028
CIL:53031
NCBI Organism Classification
Homo sapiens
Biological Process
Copy number of hTERT, c-MYC, and SE7 determined by colored probes
Cellular Component
hTERT, c-MYC, and SE7 gene regions
Image 2, z=19 from SC_028
CIL:53032
NCBI Organism Classification
Homo sapiens
Biological Process
Copy number of hTERT, c-MYC, and SE7 determined by colored probes
Cellular Component
hTERT, c-MYC, and SE7 gene regions
Image 2, z=20 from SC_028
CIL:53033
NCBI Organism Classification
Homo sapiens
Biological Process
Copy number of hTERT, c-MYC, and SE7 determined by colored probes
Cellular Component
hTERT, c-MYC, and SE7 gene regions
Image 2, z=21 from SC_028
CIL:53034
NCBI Organism Classification
Homo sapiens
Biological Process
Copy number of hTERT, c-MYC, and SE7 determined by colored probes
Cellular Component
hTERT, c-MYC, and SE7 gene regions
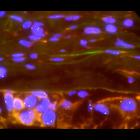
Image 3, z=1 from SC_028
CIL:53035
NCBI Organism Classification
Homo sapiens
Biological Process
Copy number of hTERT, c-MYC, and SE7 determined by colored probes
Cellular Component
hTERT, c-MYC, and SE7 gene regions
Image 3, z=2 from SC_028
CIL:53036
NCBI Organism Classification
Homo sapiens
Biological Process
Copy number of hTERT, c-MYC, and SE7 determined by colored probes
Cellular Component
hTERT, c-MYC, and SE7 gene regions
Image 3, z=3 from SC_028
CIL:53037
NCBI Organism Classification
Homo sapiens
Biological Process
Copy number of hTERT, c-MYC, and SE7 determined by colored probes
Cellular Component
hTERT, c-MYC, and SE7 gene regions
Image 3, z=4 from SC_028
CIL:53038
NCBI Organism Classification
Homo sapiens
Biological Process
Copy number of hTERT, c-MYC, and SE7 determined by colored probes
Cellular Component
hTERT, c-MYC, and SE7 gene regions
Image 3, z=5 from SC_028
CIL:53039
NCBI Organism Classification
Homo sapiens
Biological Process
Copy number of hTERT, c-MYC, and SE7 determined by colored probes
Cellular Component
hTERT, c-MYC, and SE7 gene regions
Image 3, z=6 from SC_028
CIL:53040
NCBI Organism Classification
Homo sapiens
Biological Process
Copy number of hTERT, c-MYC, and SE7 determined by colored probes
Cellular Component
hTERT, c-MYC, and SE7 gene regions
Image 3, z=7 from SC_028
CIL:53041
NCBI Organism Classification
Homo sapiens
Biological Process
Copy number of hTERT, c-MYC, and SE7 determined by colored probes
Cellular Component
hTERT, c-MYC, and SE7 gene regions
Image 3, z=8 from SC_028
CIL:53042
NCBI Organism Classification
Homo sapiens
Biological Process
Copy number of hTERT, c-MYC, and SE7 determined by colored probes
Cellular Component
hTERT, c-MYC, and SE7 gene regions
Image 3, z=9 from SC_028
CIL:53043
NCBI Organism Classification
Homo sapiens
Biological Process
Copy number of hTERT, c-MYC, and SE7 determined by colored probes
Cellular Component
hTERT, c-MYC, and SE7 gene regions
Image 3, z=10 from SC_028
CIL:53044
NCBI Organism Classification
Homo sapiens
Biological Process
Copy number of hTERT, c-MYC, and SE7 determined by colored probes
Cellular Component
hTERT, c-MYC, and SE7 gene regions
Image 3, z=11 from SC_028
CIL:53045
NCBI Organism Classification
Homo sapiens
Biological Process
Copy number of hTERT, c-MYC, and SE7 determined by colored probes
Cellular Component
hTERT, c-MYC, and SE7 gene regions
Image 3, z=12 from SC_028
CIL:53046
NCBI Organism Classification
Homo sapiens
Biological Process
Copy number of hTERT, c-MYC, and SE7 determined by colored probes
Cellular Component
hTERT, c-MYC, and SE7 gene regions
Image 3, z=13 from SC_028
CIL:53047
NCBI Organism Classification
Homo sapiens
Biological Process
Copy number of hTERT, c-MYC, and SE7 determined by colored probes
Cellular Component
hTERT, c-MYC, and SE7 gene regions
Image 3, z=14 from SC_028
CIL:53048
NCBI Organism Classification
Homo sapiens
Biological Process
Copy number of hTERT, c-MYC, and SE7 determined by colored probes
Cellular Component
hTERT, c-MYC, and SE7 gene regions
Image 3, z=15 from SC_028
CIL:53049
NCBI Organism Classification
Homo sapiens
Biological Process
Copy number of hTERT, c-MYC, and SE7 determined by colored probes
Cellular Component
hTERT, c-MYC, and SE7 gene regions
Image 3, z=16 from SC_028
CIL:53050
NCBI Organism Classification
Homo sapiens
Biological Process
Copy number of hTERT, c-MYC, and SE7 determined by colored probes
Cellular Component
hTERT, c-MYC, and SE7 gene regions
Image 3, z=17 from SC_028
CIL:53051
NCBI Organism Classification
Homo sapiens
Biological Process
Copy number of hTERT, c-MYC, and SE7 determined by colored probes
Cellular Component
hTERT, c-MYC, and SE7 gene regions
Image 3, z=18 from SC_028
CIL:53052
NCBI Organism Classification
Homo sapiens
Biological Process
Copy number of hTERT, c-MYC, and SE7 determined by colored probes
Cellular Component
hTERT, c-MYC, and SE7 gene regions
Image 3, z=19 from SC_028
CIL:53053
NCBI Organism Classification
Homo sapiens
Biological Process
Copy number of hTERT, c-MYC, and SE7 determined by colored probes
Cellular Component
hTERT, c-MYC, and SE7 gene regions
Image 3, z=20 from SC_028
CIL:53054
NCBI Organism Classification
Homo sapiens
Biological Process
Copy number of hTERT, c-MYC, and SE7 determined by colored probes
Cellular Component
hTERT, c-MYC, and SE7 gene regions
Image 3, z=21 from SC_028
CIL:53055
NCBI Organism Classification
Homo sapiens
Biological Process
Copy number of hTERT, c-MYC, and SE7 determined by colored probes
Cellular Component
hTERT, c-MYC, and SE7 gene regions
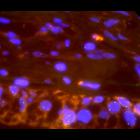
Image 4, z=1 from SC_028
CIL:53056
NCBI Organism Classification
Homo sapiens
Biological Process
Copy number of hTERT, c-MYC, and SE7 determined by colored probes
Cellular Component
hTERT, c-MYC, and SE7 gene regions
Image 4, z=2 from SC_028
CIL:53057
NCBI Organism Classification
Homo sapiens
Biological Process
Copy number of hTERT, c-MYC, and SE7 determined by colored probes
Cellular Component
hTERT, c-MYC, and SE7 gene regions
Image 4, z=3 from SC_028
CIL:53058
NCBI Organism Classification
Homo sapiens
Biological Process
Copy number of hTERT, c-MYC, and SE7 determined by colored probes
Cellular Component
hTERT, c-MYC, and SE7 gene regions
Image 4, z=4 from SC_028
CIL:53059
NCBI Organism Classification
Homo sapiens
Biological Process
Copy number of hTERT, c-MYC, and SE7 determined by colored probes
Cellular Component
hTERT, c-MYC, and SE7 gene regions
Image 4, z=5 from SC_028
CIL:53060
NCBI Organism Classification
Homo sapiens
Biological Process
Copy number of hTERT, c-MYC, and SE7 determined by colored probes
Cellular Component
hTERT, c-MYC, and SE7 gene regions
Image 4, z=6 from SC_028
CIL:53061
NCBI Organism Classification
Homo sapiens
Biological Process
Copy number of hTERT, c-MYC, and SE7 determined by colored probes
Cellular Component
hTERT, c-MYC, and SE7 gene regions
Image 4, z=7 from SC_028
CIL:53062
NCBI Organism Classification
Homo sapiens
Biological Process
Copy number of hTERT, c-MYC, and SE7 determined by colored probes
Cellular Component
hTERT, c-MYC, and SE7 gene regions
Image 4, z=8 from SC_028
CIL:53063
NCBI Organism Classification
Homo sapiens
Biological Process
Copy number of hTERT, c-MYC, and SE7 determined by colored probes
Cellular Component
hTERT, c-MYC, and SE7 gene regions
Image 4, z=9 from SC_028
CIL:53064
NCBI Organism Classification
Homo sapiens
Biological Process
Copy number of hTERT, c-MYC, and SE7 determined by colored probes
Cellular Component
hTERT, c-MYC, and SE7 gene regions
Image 4, z=10 from SC_028
CIL:53065
NCBI Organism Classification
Homo sapiens
Biological Process
Copy number of hTERT, c-MYC, and SE7 determined by colored probes
Cellular Component
hTERT, c-MYC, and SE7 gene regions
Image 4, z=11 from SC_028
CIL:53066
NCBI Organism Classification
Homo sapiens
Biological Process
Copy number of hTERT, c-MYC, and SE7 determined by colored probes
Cellular Component
hTERT, c-MYC, and SE7 gene regions
Image 4, z=12 from SC_028
CIL:53067
NCBI Organism Classification
Homo sapiens
Biological Process
Copy number of hTERT, c-MYC, and SE7 determined by colored probes
Cellular Component
hTERT, c-MYC, and SE7 gene regions
Image 4, z=13 from SC_028
CIL:53068
NCBI Organism Classification
Homo sapiens
Biological Process
Copy number of hTERT, c-MYC, and SE7 determined by colored probes
Cellular Component
hTERT, c-MYC, and SE7 gene regions
Image 4, z=14 from SC_028
CIL:53069
NCBI Organism Classification
Homo sapiens
Biological Process
Copy number of hTERT, c-MYC, and SE7 determined by colored probes
Cellular Component
hTERT, c-MYC, and SE7 gene regions
Image 4, z=15 from SC_028
CIL:53070
NCBI Organism Classification
Homo sapiens
Biological Process
Copy number of hTERT, c-MYC, and SE7 determined by colored probes
Cellular Component
hTERT, c-MYC, and SE7 gene regions
Image 4, z=16 from SC_028
CIL:53071
NCBI Organism Classification
Homo sapiens
Biological Process
Copy number of hTERT, c-MYC, and SE7 determined by colored probes
Cellular Component
hTERT, c-MYC, and SE7 gene regions
Image 4, z=17 from SC_028
CIL:53072
NCBI Organism Classification
Homo sapiens
Biological Process
Copy number of hTERT, c-MYC, and SE7 determined by colored probes
Cellular Component
hTERT, c-MYC, and SE7 gene regions
Image 4, z=18 from SC_028
CIL:53073
NCBI Organism Classification
Homo sapiens
Biological Process
Copy number of hTERT, c-MYC, and SE7 determined by colored probes
Cellular Component
hTERT, c-MYC, and SE7 gene regions
Image 4, z=19 from SC_028
CIL:53074
NCBI Organism Classification
Homo sapiens
Biological Process
Copy number of hTERT, c-MYC, and SE7 determined by colored probes
Cellular Component
hTERT, c-MYC, and SE7 gene regions
Image 4, z=20 from SC_028
CIL:53075
NCBI Organism Classification
Homo sapiens
Biological Process
Copy number of hTERT, c-MYC, and SE7 determined by colored probes
Cellular Component
hTERT, c-MYC, and SE7 gene regions
Image 4, z=21 from SC_028

")