Alternate header for print version
Advanced search
Contributors
Help
Submit
Search
menu
Cell Process
Cell Component
Cell Type
Organism
Microbial
Alzheimer's
Data Sets
University of California, San Diego
9500 Gilman Drive
La Jolla, CA 92093-0608, USA
Voice
: (858) 534-0276
Fax
: (858) 534-7497
Email
: dorloff@ncmir.ucsd.edu
Grouped images - the images shown below are related
CIL:52929
NCBI Organism Classification
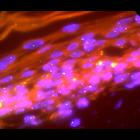
Homo sapiens
Biological Process
Copy number of hTERT, c-MYC, and SE7 determined by colored probes
Cellular Component
hTERT, c-MYC, and SE7 gene regions
Image 2, z=1 from SC_011
CIL:52930
NCBI Organism Classification
Homo sapiens
Biological Process
Copy number of hTERT, c-MYC, and SE7 determined by colored probes
Cellular Component
hTERT, c-MYC, and SE7 gene regions
Image 2, z=2 from SC_011
CIL:52931
NCBI Organism Classification
Homo sapiens
Biological Process
Copy number of hTERT, c-MYC, and SE7 determined by colored probes
Cellular Component
hTERT, c-MYC, and SE7 gene regions
Image 2, z=3 from SC_011
CIL:52932
NCBI Organism Classification
Homo sapiens
Biological Process
Copy number of hTERT, c-MYC, and SE7 determined by colored probes
Cellular Component
hTERT, c-MYC, and SE7 gene regions
Image 2, z=4 from SC_011
CIL:52933
NCBI Organism Classification
Homo sapiens
Biological Process
Copy number of hTERT, c-MYC, and SE7 determined by colored probes
Cellular Component
hTERT, c-MYC, and SE7 gene regions
Image 2, z=5 from SC_011
CIL:52934
NCBI Organism Classification
Homo sapiens
Biological Process
Copy number of hTERT, c-MYC, and SE7 determined by colored probes
Cellular Component
hTERT, c-MYC, and SE7 gene regions
Image 2, z=6 from SC_011
CIL:52935
NCBI Organism Classification
Homo sapiens
Biological Process
Copy number of hTERT, c-MYC, and SE7 determined by colored probes
Cellular Component
hTERT, c-MYC, and SE7 gene regions
Image 2, z=7 from SC_011
CIL:52936
NCBI Organism Classification
Homo sapiens
Biological Process
Copy number of hTERT, c-MYC, and SE7 determined by colored probes
Cellular Component
hTERT, c-MYC, and SE7 gene regions
Image 2, z=8 from SC_011
CIL:52937
NCBI Organism Classification
Homo sapiens
Biological Process
Copy number of hTERT, c-MYC, and SE7 determined by colored probes
Cellular Component
hTERT, c-MYC, and SE7 gene regions
Image 2, z=9 from SC_011
CIL:52938
NCBI Organism Classification
Homo sapiens
Biological Process
Copy number of hTERT, c-MYC, and SE7 determined by colored probes
Cellular Component
hTERT, c-MYC, and SE7 gene regions
Image 2, z=10 from SC_011
CIL:52939
NCBI Organism Classification
Homo sapiens
Biological Process
Copy number of hTERT, c-MYC, and SE7 determined by colored probes
Cellular Component
hTERT, c-MYC, and SE7 gene regions
Image 2, z=11 from SC_011
CIL:52940
NCBI Organism Classification
Homo sapiens
Biological Process
Copy number of hTERT, c-MYC, and SE7 determined by colored probes
Cellular Component
hTERT, c-MYC, and SE7 gene regions
Image 2, z=12 from SC_011
CIL:52941
NCBI Organism Classification
Homo sapiens
Biological Process
Copy number of hTERT, c-MYC, and SE7 determined by colored probes
Cellular Component
hTERT, c-MYC, and SE7 gene regions
Image 2, z=13 from SC_011
CIL:52942
NCBI Organism Classification
Homo sapiens
Biological Process
Copy number of hTERT, c-MYC, and SE7 determined by colored probes
Cellular Component
hTERT, c-MYC, and SE7 gene regions
Image 2, z=14 from SC_011
CIL:52943
NCBI Organism Classification
Homo sapiens
Biological Process
Copy number of hTERT, c-MYC, and SE7 determined by colored probes
Cellular Component
hTERT, c-MYC, and SE7 gene regions
Image 2, z=15 from SC_011
CIL:52944
NCBI Organism Classification
Homo sapiens
Biological Process
Copy number of hTERT, c-MYC, and SE7 determined by colored probes
Cellular Component
hTERT, c-MYC, and SE7 gene regions
Image 2, z=16 from SC_011
CIL:52945
NCBI Organism Classification
Homo sapiens
Biological Process
Copy number of hTERT, c-MYC, and SE7 determined by colored probes
Cellular Component
hTERT, c-MYC, and SE7 gene regions
Image 2, z=17 from SC_011
CIL:52946
NCBI Organism Classification
Homo sapiens
Biological Process
Copy number of hTERT, c-MYC, and SE7 determined by colored probes
Cellular Component
hTERT, c-MYC, and SE7 gene regions
Image 2, z=18 from SC_011
CIL:52947
NCBI Organism Classification
Homo sapiens
Biological Process
Copy number of hTERT, c-MYC, and SE7 determined by colored probes
Cellular Component
hTERT, c-MYC, and SE7 gene regions
Image 2, z=19 from SC_011
CIL:52948
NCBI Organism Classification
Homo sapiens
Biological Process
Copy number of hTERT, c-MYC, and SE7 determined by colored probes
Cellular Component
hTERT, c-MYC, and SE7 gene regions
Image 2, z=20 from SC_011
CIL:52949
NCBI Organism Classification
Homo sapiens
Biological Process
Copy number of hTERT, c-MYC, and SE7 determined by colored probes
Cellular Component
hTERT, c-MYC, and SE7 gene regions
Image 2, z=21 from SC_011
CIL:52950
NCBI Organism Classification
Homo sapiens
Biological Process
Copy number of hTERT, c-MYC, and SE7 determined by colored probes
Cellular Component
hTERT, c-MYC, and SE7 gene regions
Image 4, z=1 from SC_011
CIL:52951
NCBI Organism Classification
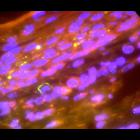
Homo sapiens
Biological Process
Copy number of hTERT, c-MYC, and SE7 determined by colored probes
Cellular Component
hTERT, c-MYC, and SE7 gene regions
Image 4, z=2 from SC_011
CIL:52952
NCBI Organism Classification
Homo sapiens
Biological Process
Copy number of hTERT, c-MYC, and SE7 determined by colored probes
Cellular Component
hTERT, c-MYC, and SE7 gene regions
Image 4, z=3 from SC_011
CIL:52953
NCBI Organism Classification
Homo sapiens
Biological Process
Copy number of hTERT, c-MYC, and SE7 determined by colored probes
Cellular Component
hTERT, c-MYC, and SE7 gene regions
Image 4, z=4 from SC_011
CIL:52954
NCBI Organism Classification
Homo sapiens
Biological Process
Copy number of hTERT, c-MYC, and SE7 determined by colored probes
Cellular Component
hTERT, c-MYC, and SE7 gene regions
Image 4, z=5 from SC_011
CIL:52955
NCBI Organism Classification
Homo sapiens
Biological Process
Copy number of hTERT, c-MYC, and SE7 determined by colored probes
Cellular Component
hTERT, c-MYC, and SE7 gene regions
Image 4, z=6 from SC_011
CIL:52956
NCBI Organism Classification
Homo sapiens
Biological Process
Copy number of hTERT, c-MYC, and SE7 determined by colored probes
Cellular Component
hTERT, c-MYC, and SE7 gene regions
Image 4, z=7 from SC_011
CIL:52957
NCBI Organism Classification
Homo sapiens
Biological Process
Copy number of hTERT, c-MYC, and SE7 determined by colored probes
Cellular Component
hTERT, c-MYC, and SE7 gene regions
Image 4, z=8 from SC_011
CIL:52958
NCBI Organism Classification
Homo sapiens
Biological Process
Copy number of hTERT, c-MYC, and SE7 determined by colored probes
Cellular Component
hTERT, c-MYC, and SE7 gene regions
Image 4, z=9 from SC_011
CIL:52959
NCBI Organism Classification
Homo sapiens
Biological Process
Copy number of hTERT, c-MYC, and SE7 determined by colored probes
Cellular Component
hTERT, c-MYC, and SE7 gene regions
Image 4, z=10 from SC_011
CIL:52960
NCBI Organism Classification
Homo sapiens
Biological Process
Copy number of hTERT, c-MYC, and SE7 determined by colored probes
Cellular Component
hTERT, c-MYC, and SE7 gene regions
Image 4, z=11 from SC_011
CIL:52961
NCBI Organism Classification
Homo sapiens
Biological Process
Copy number of hTERT, c-MYC, and SE7 determined by colored probes
Cellular Component
hTERT, c-MYC, and SE7 gene regions
Image 4, z=12 from SC_011
CIL:52962
NCBI Organism Classification
Homo sapiens
Biological Process
Copy number of hTERT, c-MYC, and SE7 determined by colored probes
Cellular Component
hTERT, c-MYC, and SE7 gene regions
Image 4, z=13 from SC_011
CIL:52963
NCBI Organism Classification
Homo sapiens
Biological Process
Copy number of hTERT, c-MYC, and SE7 determined by colored probes
Cellular Component
hTERT, c-MYC, and SE7 gene regions
Image 4, z=14 from SC_011
CIL:52964
NCBI Organism Classification
Homo sapiens
Biological Process
Copy number of hTERT, c-MYC, and SE7 determined by colored probes
Cellular Component
hTERT, c-MYC, and SE7 gene regions
Image 4, z=15 from SC_011
CIL:52965
NCBI Organism Classification
Homo sapiens
Biological Process
Copy number of hTERT, c-MYC, and SE7 determined by colored probes
Cellular Component
hTERT, c-MYC, and SE7 gene regions
Image 4, z=16 from SC_011
CIL:52966
NCBI Organism Classification
Homo sapiens
Biological Process
Copy number of hTERT, c-MYC, and SE7 determined by colored probes
Cellular Component
hTERT, c-MYC, and SE7 gene regions
Image 4, z=17 from SC_011
CIL:52967
NCBI Organism Classification
Homo sapiens
Biological Process
Copy number of hTERT, c-MYC, and SE7 determined by colored probes
Cellular Component
hTERT, c-MYC, and SE7 gene regions
Image 4, z=18 from SC_011
CIL:52968
NCBI Organism Classification
Homo sapiens
Biological Process
Copy number of hTERT, c-MYC, and SE7 determined by colored probes
Cellular Component
hTERT, c-MYC, and SE7 gene regions
Image 4, z=19 from SC_011
CIL:52969
NCBI Organism Classification
Homo sapiens
Biological Process
Copy number of hTERT, c-MYC, and SE7 determined by colored probes
Cellular Component
hTERT, c-MYC, and SE7 gene regions
Image 4, z=20 from SC_011
CIL:52970
NCBI Organism Classification
Homo sapiens
Biological Process
Copy number of hTERT, c-MYC, and SE7 determined by colored probes
Cellular Component
hTERT, c-MYC, and SE7 gene regions
Image 4, z=21 from SC_011
CIL:52971
NCBI Organism Classification
Homo sapiens
Biological Process
Copy number of hTERT, c-MYC, and SE7 determined by colored probes
Cellular Component
hTERT, c-MYC, and SE7 gene regions
Image 5, z=1 from SC_011
CIL:52972
NCBI Organism Classification
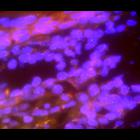
Homo sapiens
Biological Process
Copy number of hTERT, c-MYC, and SE7 determined by colored probes
Cellular Component
hTERT, c-MYC, and SE7 gene regions
Image 5, z=2 from SC_011
CIL:52973
NCBI Organism Classification
Homo sapiens
Biological Process
Copy number of hTERT, c-MYC, and SE7 determined by colored probes
Cellular Component
hTERT, c-MYC, and SE7 gene regions
Image 5, z=3 from SC_011
CIL:52974
NCBI Organism Classification
Homo sapiens
Biological Process
Copy number of hTERT, c-MYC, and SE7 determined by colored probes
Cellular Component
hTERT, c-MYC, and SE7 gene regions
Image 5, z=4 from SC_011
CIL:52975
NCBI Organism Classification
Homo sapiens
Biological Process
Copy number of hTERT, c-MYC, and SE7 determined by colored probes
Cellular Component
hTERT, c-MYC, and SE7 gene regions
Image 5, z=5 from SC_011
CIL:52976
NCBI Organism Classification
Homo sapiens
Biological Process
Copy number of hTERT, c-MYC, and SE7 determined by colored probes
Cellular Component
hTERT, c-MYC, and SE7 gene regions
Image 5, z=6 from SC_011
CIL:52977
NCBI Organism Classification
Homo sapiens
Biological Process
Copy number of hTERT, c-MYC, and SE7 determined by colored probes
Cellular Component
hTERT, c-MYC, and SE7 gene regions
Image 5, z=7 from SC_011
CIL:52978
NCBI Organism Classification
Homo sapiens
Biological Process
Copy number of hTERT, c-MYC, and SE7 determined by colored probes
Cellular Component
hTERT, c-MYC, and SE7 gene regions
Image 5, z=8 from SC_011
CIL:52979
NCBI Organism Classification
Homo sapiens
Biological Process
Copy number of hTERT, c-MYC, and SE7 determined by colored probes
Cellular Component
hTERT, c-MYC, and SE7 gene regions
Image 5, z=9 from SC_011
CIL:52980
NCBI Organism Classification
Homo sapiens
Biological Process
Copy number of hTERT, c-MYC, and SE7 determined by colored probes
Cellular Component
hTERT, c-MYC, and SE7 gene regions
Image 5, z=10 from SC_011
CIL:52981
NCBI Organism Classification
Homo sapiens
Biological Process
Copy number of hTERT, c-MYC, and SE7 determined by colored probes
Cellular Component
hTERT, c-MYC, and SE7 gene regions
Image 5, z=11 from SC_011
CIL:52982
NCBI Organism Classification
Homo sapiens
Biological Process
Copy number of hTERT, c-MYC, and SE7 determined by colored probes
Cellular Component
hTERT, c-MYC, and SE7 gene regions
Image 5, z=12 from SC_011
CIL:52983
NCBI Organism Classification
Homo sapiens
Biological Process
Copy number of hTERT, c-MYC, and SE7 determined by colored probes
Cellular Component
hTERT, c-MYC, and SE7 gene regions
Image 5, z=13 from SC_011
CIL:52984
NCBI Organism Classification
Homo sapiens
Biological Process
Copy number of hTERT, c-MYC, and SE7 determined by colored probes
Cellular Component
hTERT, c-MYC, and SE7 gene regions
Image 5, z=14 from SC_011
CIL:52985
NCBI Organism Classification
Homo sapiens
Biological Process
Copy number of hTERT, c-MYC, and SE7 determined by colored probes
Cellular Component
hTERT, c-MYC, and SE7 gene regions
Image 5, z=15 from SC_011
CIL:52986
NCBI Organism Classification
Homo sapiens
Biological Process
Copy number of hTERT, c-MYC, and SE7 determined by colored probes
Cellular Component
hTERT, c-MYC, and SE7 gene regions
Image 5, z=16 from SC_011
CIL:52987
NCBI Organism Classification
Homo sapiens
Biological Process
Copy number of hTERT, c-MYC, and SE7 determined by colored probes
Cellular Component
hTERT, c-MYC, and SE7 gene regions
Image 5, z=17 from SC_011
CIL:52988
NCBI Organism Classification
Homo sapiens
Biological Process
Copy number of hTERT, c-MYC, and SE7 determined by colored probes
Cellular Component
hTERT, c-MYC, and SE7 gene regions
Image 5, z=18 from SC_011
CIL:52989
NCBI Organism Classification
Homo sapiens
Biological Process
Copy number of hTERT, c-MYC, and SE7 determined by colored probes
Cellular Component
hTERT, c-MYC, and SE7 gene regions
Image 5, z=19 from SC_011
CIL:52990
NCBI Organism Classification
Homo sapiens
Biological Process
Copy number of hTERT, c-MYC, and SE7 determined by colored probes
Cellular Component
hTERT, c-MYC, and SE7 gene regions
Image 5, z=20 from SC_011
CIL:52991
NCBI Organism Classification
Homo sapiens
Biological Process
Copy number of hTERT, c-MYC, and SE7 determined by colored probes
Cellular Component
hTERT, c-MYC, and SE7 gene regions
Image 5, z=21 from SC_011

")