Alternate header for print version
Advanced search
Contributors
Help
Submit
Search
menu
Cell Process
Cell Component
Cell Type
Organism
Microbial
Alzheimer's
Data Sets
University of California, San Diego
9500 Gilman Drive
La Jolla, CA 92093-0608, USA
Voice
: (858) 534-0276
Fax
: (858) 534-7497
Email
: dorloff@ncmir.ucsd.edu
Grouped images - the images shown below are related
CIL:52887
NCBI Organism Classification
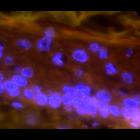
Homo sapiens
Biological Process
Copy number of hTERT, c-MYC, and SE7 determined by colored probes
Cellular Component
hTERT, c-MYC, and SE7 gene regions
Image 9, z=1 from SC_007
CIL:52888
NCBI Organism Classification
Homo sapiens
Biological Process
Copy number of hTERT, c-MYC, and SE7 determined by colored probes
Cellular Component
hTERT, c-MYC, and SE7 gene regions
Image 9, z=2 from SC_007
CIL:52889
NCBI Organism Classification
Homo sapiens
Biological Process
Copy number of hTERT, c-MYC, and SE7 determined by colored probes
Cellular Component
hTERT, c-MYC, and SE7 gene regions
Image 9, z=3 from SC_007
CIL:52890
NCBI Organism Classification
Homo sapiens
Biological Process
Copy number of hTERT, c-MYC, and SE7 determined by colored probes
Cellular Component
hTERT, c-MYC, and SE7 gene regions
Image 9, z=4 from SC_007
CIL:52891
NCBI Organism Classification
Homo sapiens
Biological Process
Copy number of hTERT, c-MYC, and SE7 determined by colored probes
Cellular Component
hTERT, c-MYC, and SE7 gene regions
Image 9, z=5 from SC_007
CIL:52892
NCBI Organism Classification
Homo sapiens
Biological Process
Copy number of hTERT, c-MYC, and SE7 determined by colored probes
Cellular Component
hTERT, c-MYC, and SE7 gene regions
Image 9, z=6 from SC_007
CIL:52893
NCBI Organism Classification
Homo sapiens
Biological Process
Copy number of hTERT, c-MYC, and SE7 determined by colored probes
Cellular Component
hTERT, c-MYC, and SE7 gene regions
Image 9, z=7 from SC_007
CIL:52894
NCBI Organism Classification
Homo sapiens
Biological Process
Copy number of hTERT, c-MYC, and SE7 determined by colored probes
Cellular Component
hTERT, c-MYC, and SE7 gene regions
Image 9, z=8 from SC_007
CIL:52895
NCBI Organism Classification
Homo sapiens
Biological Process
Copy number of hTERT, c-MYC, and SE7 determined by colored probes
Cellular Component
hTERT, c-MYC, and SE7 gene regions
Image 9, z=9 from SC_007
CIL:52896
NCBI Organism Classification
Homo sapiens
Biological Process
Copy number of hTERT, c-MYC, and SE7 determined by colored probes
Cellular Component
hTERT, c-MYC, and SE7 gene regions
Image 9, z=10 from SC_007
CIL:52897
NCBI Organism Classification
Homo sapiens
Biological Process
Copy number of hTERT, c-MYC, and SE7 determined by colored probes
Cellular Component
hTERT, c-MYC, and SE7 gene regions
Image 9, z=11 from SC_007
CIL:52898
NCBI Organism Classification
Homo sapiens
Biological Process
Copy number of hTERT, c-MYC, and SE7 determined by colored probes
Cellular Component
hTERT, c-MYC, and SE7 gene regions
Image 9, z=12 from SC_007
CIL:52899
NCBI Organism Classification
Homo sapiens
Biological Process
Copy number of hTERT, c-MYC, and SE7 determined by colored probes
Cellular Component
hTERT, c-MYC, and SE7 gene regions
Image 9, z=13 from SC_007
CIL:52900
NCBI Organism Classification
Homo sapiens
Biological Process
Copy number of hTERT, c-MYC, and SE7 determined by colored probes
Cellular Component
hTERT, c-MYC, and SE7 gene regions
Image 9, z=14 from SC_007
CIL:52901
NCBI Organism Classification
Homo sapiens
Biological Process
Copy number of hTERT, c-MYC, and SE7 determined by colored probes
Cellular Component
hTERT, c-MYC, and SE7 gene regions
Image 9, z=15 from SC_007
CIL:52902
NCBI Organism Classification
Homo sapiens
Biological Process
Copy number of hTERT, c-MYC, and SE7 determined by colored probes
Cellular Component
hTERT, c-MYC, and SE7 gene regions
Image 9, z=16 from SC_007
CIL:52903
NCBI Organism Classification
Homo sapiens
Biological Process
Copy number of hTERT, c-MYC, and SE7 determined by colored probes
Cellular Component
hTERT, c-MYC, and SE7 gene regions
Image 9, z=17 from SC_007
CIL:52904
NCBI Organism Classification
Homo sapiens
Biological Process
Copy number of hTERT, c-MYC, and SE7 determined by colored probes
Cellular Component
hTERT, c-MYC, and SE7 gene regions
Image 9, z=18 from SC_007
CIL:52905
NCBI Organism Classification
Homo sapiens
Biological Process
Copy number of hTERT, c-MYC, and SE7 determined by colored probes
Cellular Component
hTERT, c-MYC, and SE7 gene regions
Image 9, z=19 from SC_007
CIL:52906
NCBI Organism Classification
Homo sapiens
Biological Process
Copy number of hTERT, c-MYC, and SE7 determined by colored probes
Cellular Component
hTERT, c-MYC, and SE7 gene regions
Image 9, z=20 from SC_007
CIL:52907
NCBI Organism Classification
Homo sapiens
Biological Process
Copy number of hTERT, c-MYC, and SE7 determined by colored probes
Cellular Component
hTERT, c-MYC, and SE7 gene regions
Image 9, z=21 from SC_007
CIL:52908
NCBI Organism Classification
Homo sapiens
Biological Process
Copy number of hTERT, c-MYC, and SE7 determined by colored probes
Cellular Component
hTERT, c-MYC, and SE7 gene regions
Image 11, z=1 from SC_007
CIL:52909
NCBI Organism Classification
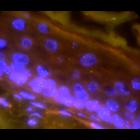
Homo sapiens
Biological Process
Copy number of hTERT, c-MYC, and SE7 determined by colored probes
Cellular Component
hTERT, c-MYC, and SE7 gene regions
Image 11, z=2 from SC_007
CIL:52910
NCBI Organism Classification
Homo sapiens
Biological Process
Copy number of hTERT, c-MYC, and SE7 determined by colored probes
Cellular Component
hTERT, c-MYC, and SE7 gene regions
Image 11, z=3 from SC_007
CIL:52911
NCBI Organism Classification
Homo sapiens
Biological Process
Copy number of hTERT, c-MYC, and SE7 determined by colored probes
Cellular Component
hTERT, c-MYC, and SE7 gene regions
Image 11, z=4 from SC_007
CIL:52912
NCBI Organism Classification
Homo sapiens
Biological Process
Copy number of hTERT, c-MYC, and SE7 determined by colored probes
Cellular Component
hTERT, c-MYC, and SE7 gene regions
Image 11, z=5 from SC_007
CIL:52913
NCBI Organism Classification
Homo sapiens
Biological Process
Copy number of hTERT, c-MYC, and SE7 determined by colored probes
Cellular Component
hTERT, c-MYC, and SE7 gene regions
Image 11, z=6 from SC_007
CIL:52914
NCBI Organism Classification
Homo sapiens
Biological Process
Copy number of hTERT, c-MYC, and SE7 determined by colored probes
Cellular Component
hTERT, c-MYC, and SE7 gene regions
Image 11, z=7 from SC_007
CIL:52915
NCBI Organism Classification
Homo sapiens
Biological Process
Copy number of hTERT, c-MYC, and SE7 determined by colored probes
Cellular Component
hTERT, c-MYC, and SE7 gene regions
Image 11, z=8 from SC_007
CIL:52916
NCBI Organism Classification
Homo sapiens
Biological Process
Copy number of hTERT, c-MYC, and SE7 determined by colored probes
Cellular Component
hTERT, c-MYC, and SE7 gene regions
Image 11, z=9 from SC_007
CIL:52917
NCBI Organism Classification
Homo sapiens
Biological Process
Copy number of hTERT, c-MYC, and SE7 determined by colored probes
Cellular Component
hTERT, c-MYC, and SE7 gene regions
Image 11, z=10 from SC_007
CIL:52918
NCBI Organism Classification
Homo sapiens
Biological Process
Copy number of hTERT, c-MYC, and SE7 determined by colored probes
Cellular Component
hTERT, c-MYC, and SE7 gene regions
Image 11, z=11 from SC_007
CIL:52919
NCBI Organism Classification
Homo sapiens
Biological Process
Copy number of hTERT, c-MYC, and SE7 determined by colored probes
Cellular Component
hTERT, c-MYC, and SE7 gene regions
Image 11, z=12 from SC_007
CIL:52920
NCBI Organism Classification
Homo sapiens
Biological Process
Copy number of hTERT, c-MYC, and SE7 determined by colored probes
Cellular Component
hTERT, c-MYC, and SE7 gene regions
Image 11, z=13 from SC_007
CIL:52921
NCBI Organism Classification
Homo sapiens
Biological Process
Copy number of hTERT, c-MYC, and SE7 determined by colored probes
Cellular Component
hTERT, c-MYC, and SE7 gene regions
Image 11, z=14 from SC_007
CIL:52922
NCBI Organism Classification
Homo sapiens
Biological Process
Copy number of hTERT, c-MYC, and SE7 determined by colored probes
Cellular Component
hTERT, c-MYC, and SE7 gene regions
Image 11, z=15 from SC_007
CIL:52923
NCBI Organism Classification
Homo sapiens
Biological Process
Copy number of hTERT, c-MYC, and SE7 determined by colored probes
Cellular Component
hTERT, c-MYC, and SE7 gene regions
Image 11, z=16 from SC_007
CIL:52924
NCBI Organism Classification
Homo sapiens
Biological Process
Copy number of hTERT, c-MYC, and SE7 determined by colored probes
Cellular Component
hTERT, c-MYC, and SE7 gene regions
Image 11, z=17 from SC_007
CIL:52925
NCBI Organism Classification
Homo sapiens
Biological Process
Copy number of hTERT, c-MYC, and SE7 determined by colored probes
Cellular Component
hTERT, c-MYC, and SE7 gene regions
Image 11, z=18 from SC_007
CIL:52926
NCBI Organism Classification
Homo sapiens
Biological Process
Copy number of hTERT, c-MYC, and SE7 determined by colored probes
Cellular Component
hTERT, c-MYC, and SE7 gene regions
Image 11, z=19 from SC_007
CIL:52927
NCBI Organism Classification
Homo sapiens
Biological Process
Copy number of hTERT, c-MYC, and SE7 determined by colored probes
Cellular Component
hTERT, c-MYC, and SE7 gene regions
Image 11, z=20 from SC_007
CIL:52928
NCBI Organism Classification
Homo sapiens
Biological Process
Copy number of hTERT, c-MYC, and SE7 determined by colored probes
Cellular Component
hTERT, c-MYC, and SE7 gene regions
Image 11, z=21 from SC_007
")